Unlocking big data
A Newscenter series on how Rochester is using data science to change how we research, how we learn, and how we understand our world.
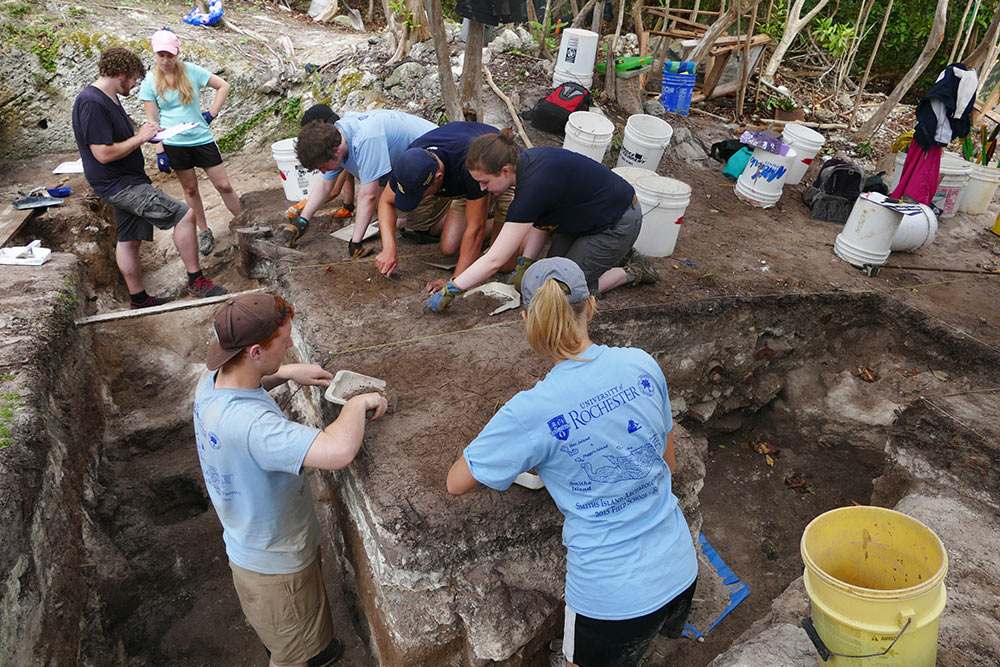
The “Oven Site” that Mike Jarvis and his students have been excavating the last five summers is 1,024 miles away in Bermuda—protectively buried, at least until next summer’s dig, under five feet of earth.
But at any time, on any day, Jarvis, an associate professor of history at the University of Rochester, can walk across campus to the Carlson Science and Engineering Library and instantly project a life-like 3-D rendering of the site—just as it looks when fully excavated—on a 20-foot-by-8-foot screen.
The resolution is so fine that it’s possible to measure post holes and other objects to within a centimeter. And if he needs to look at the excavation from another angle, he can. The rendering can be rotated in any direction—even flipped upside down.
It’s a graphic tour de force, and a great example of the data visualization capabilities of the University’s VISTA (Visualization-Innovation-Science-Technology-Application) Collaboratory.
Completed in 2014, the space features 24 individual displays arranged in a curved four-by-six matrix that can render massive data sets with 50-megapixel resolution—approaching that of IMAX theaters. The displays have a direct high-speed fiber optic connection to the University’s IBM BlueGene/Q supercomputer, which has 16,384 processing cores, and to an IBM “Bluehive 2” Linux supercomputer cluster, which can store two million gigabytes of data.
The technology gives researchers an unparalleled opportunity to visualize—and therefore, to analyze—large sets of data on a single screen with colleagues and students.
“The best analytical tool we have is still the human brain,” says David Topham, the executive director of the Health Sciences Center for Computational Innovation. “We can see relationships between data that computers cannot. But in order to do that you have to have the information in front of you, so you can see the patterns and connections that matter. . . . You need to be able to see the forest and the trees simultaneously.”
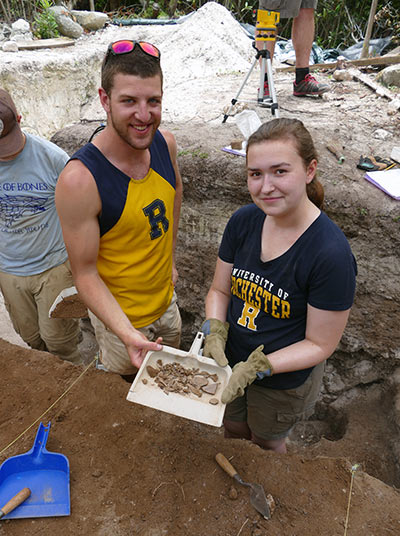
The collaboratory has become particularly useful for Jarvis, who is also director of the Digital Media Studies program in the School of Arts & Sciences, and leads two projects in Bermuda. Each summer he takes students to Smith’s Island as part of a project to systematically locate, excavate, and study all houses and activity sites, including the oven site. The 60-acre island was first settled 400 years ago.
He is also working on a “virtual” re-creation of St. George’s, Bermuda, across 12 generations, with 3-D renderings of the townscape at various key points in its history. The renderings will be combined with video game technology to allow an immersive interaction with avatars that are created based on rigorous research.
To help document the Smith’s Island excavations and bring a “virtual” St. George’s to fruition, Jarvis takes thousands of overlapping photos—1,500 at the oven site alone, and 19,000 so far at St. George’s. Then, using photogrammetry software, he “stitches” them together with into 3-D renderings.
Jarvis can do the photogrammetry with his own laptop, processors, and graphic cards. But for the kind of visual analysis Topham alludes to, he turns to the VISTA Collaboratory.
The collaboratory is also, Jarvis says, a “powerful teaching tool.” He demonstrates by bringing up on the VISTA screen a virtual landscape in which 3-D renderings of historic structures oceans apart can be placed side by side. This allows students to compare, for example, the dungeons of Elmina Castle in Ghana where slaves were held before boarding ships, with a St. Thomas sugar mill where many of them were put to work.
“We’re able to take places thousands of miles apart and bring them into a conversation with each other,” Jarvis says.
A self-described “nerd” who grew up on video games, Jarvis has seized upon the opportunities offered by modern video game technology to “better reach a rising generation of digital learners.”
“The students in my classes are clearly digital natives and are used to computer interaction,” he says. The ability to create immersive, interactive historical environments in which students “become their own detectives,” he adds, “is a win-win situation – a new way to do history education in the 21st century.”


