Hematology and Oncology
Investigating the Interaction between Macrophages and Erythroid Cells in Bone Marrow: Implications for Erythropoiesis and Anemia
Spring 2024, Volume 22, Issue 2
Xupei Ou ’24, Kathleen McGrath, Paul Kingsley, & James Palis*
https://doi.org/10.47761/JZYM6125
Background
Erythropoiesis is a complex and strictly controlled biological process that begins in the bone marrow with a multipotent stem cell and ends with mature erythroid cells, or RBCs. (2) In mammals, erythropoiesis occurs within specialized microenvironments in the bone marrow, known as erythroblastic islands. These islands are composed of maturing erythroblasts closely associated with a central macrophage. (3,4) Macrophages and erythroblasts exhibit adhesive interactions essential for maintaining the structural integrity of erythroblastic islands. (5) During erythroid maturation, erythroblastic island macrophages play an important role by supplying essential nutrients and signals that promote the proliferation and survival of erythroblasts. (5) They are also responsible for phagocytosis of the extruded nuclei from erythroblasts, a critical step in erythroid maturation. (5)
Adhesive interactions between macrophages and erythroblasts within the erythroblastic island are critical for RBC development under both physiological and pathological conditions. (6) Anemia, characterized by reduced hemoglobin concentration, arises either from an increased rate of RBC destruction in the periphery, a decreased production rate of these cells in the bone marrow, or a combination of both processes. (4) Mutations that impede the capability of macrophages to congregate within erythroblastic islands or to effectively digest nuclei of erythroblasts can lead to the development of anemia. (7) Additionally, it has been demonstrated that macrophages directly regulate the proliferation and maturation of erythroid progenitors in both normal and erythroleukemic mice models. (8) However, relatively little is known about the heterogeneity of macrophages in the bone marrow. Our lab has provided evidence that bone marrow macrophages are heterogeneous and can be categorized into three superclusters: A, B, and C, based on Uniform Manifold Approximation and Projection (UMAP) plots of single-cell RNA expression (scRNA) in bone marrow macrophages, with proportions in each cluster significantly changed in anemia compared to steady-state.
The exact mechanisms governing the interactions between erythroid cells and macrophages, and their roles in response to anemia, have not been clearly elucidated. In this project, we mostly applied imaging flow cytometry to obtain high resolution image data for the expression level of different protein markers from macrophages in both steady-state and anemic mice. By comparing the expression level between erythroid-associate macrophages (EA-mac) and total macrophages (Single-mac), we hope to identify, study, and isolate subpopulations of macrophages that physically associate with erythroid precursors in the bone marrow of mice. This will allow us to study the role of molecular markers in macrophages during steady-state and in response to acute anemia or other blood disorders using imaging flow cytometry assays.
Materials and Methods
Steady-state and anemic mice preparation: ICR mice aged between 8 and 18 weeks were used for all studies. Anemia was induced by phlebotomy. Mice were treated with two retro-orbital bleeds over 4 hours and around 1200ul (50%) of blood was removed about 72 hours prior to the experiment.
Single-mac isolation: Femoral marrow was flushed with 1ml solution of ethylenediaminetetraacetic acid (EDTA), PBS, and 25 µg/ml heparin into a tube. The isolated marrow was allowed to settle for 5 minutes, and then all but 200 µl of supernatant was removed and transferred into a new tube. The solution in the new tube was centrifuged (200g, 5 minutes). 100 µl of supernatant was discarded, and the remaining solution was resuspended and transferred back into the original tube. 200 µl StemCell Collagenase and 1.5 µl DNase I were added, and the tube was incubated at 37°C for 30 minutes. Afterwards, the solution was pipetting in the middle of the 30 minutes. The solution was then passed through a polystyrene test tube with a cell strainer snap cap. 270 µl of 16% formaldehyde was added. Then the tube was inverted a few times and left to settle at room temperature for 10 minutes. After centrifugation (200g, 5 minutes), Single-mac sample was resuspended in 1ml of PB2 for each sample.
EA-mac isolation: Femoral marrow was flushed into PB2 with 25 µg/ml heparin. The solution in the tube was pipetted approximately 10 times to dissociate EA-mac from the bone marrow. 270 µl of 16% formaldehyde was added, the tube was inverted a few times and left to settle at room temperature for 10 minutes. After centrifugation (200g, 5 minutes), EA-mac was resuspended in 1 ml of PB2 for each sample.
Cell staining: The tubes containing the samples were centrifuged (200g, 5 minutes), and the samples were resuspended in about 90 µl of PB2. Then, 10 µl of Normal Rat Serum was added, and the tubes were incubated for 15 minutes on ice. The samples were then stained with a 1:100 dilution of antibodies for 20 minutes on ice without light exposure. The antibodies used in different panels, as shown in the figures, included PE (Phycoerythrin) MHCII, PE Cx3cr1, PE CD74, PE CD9, PE CD14, PE CD16, PE LGALS3, AF488 (Alexa Fluor 488) F4/80, PEcy7 (PE-Cyanine7) Ter119, BV421 (Brilliant Violet 421) CD3, BV421 CD19, BV421 Ly6G, BV421 CD170, and BV421 CD335.
Acquisition of imaging flow cytometry data: Image data for cells were acquired on an imaging flow cytometer named ImageStreamX Mark II. Events were read in the following channels: Brightfield channels 1 (488 nm laser – 467.5/75 nm) and 9 (594 nm laser – 577.5/35 nm), AF488 channel 2 (488 nm laser – 532.5/55 nm), PE channel 3 (561 nm laser – 577.5/35 nm), PEcy7 channel 6 (561 nm laser – 627.5/65 nm), BV421 channel 7 (405 nm laser – 467.5/75 nm), and APC channel 11 (643 nm laser – 700/80 nm). Compensation for channel 3 was collected using PE IgG, channel 2 using AF488 F4/80, channel 6 using PEcy7 Ter119, channel 7 using BV421 CD3, and channel 11 using APC Ly6C. Imaging flow cytometry collected image data from bone marrow cells stained with the macrophage marker F4/80 and erythroid cell marker Ter119. Further purification of F4/80+ macrophages from contaminants was accomplished by eliminating cells that were CD3e+, CD19+, Ly6G+, CD170+, CD335+, Ly6C+, and possibly Ter119+.
Analysis of imaging flow cytometry data: Image data was analyzed using IDEAS (version 6.2, Amnis/EMDmillipore) software and its compensation wizard and gating tools. The data of image features was then extracted and used to compose graphs for further analysis using FlowJo v10 software.
Results
Identification of candidate molecular markers in bone marrow macrophages
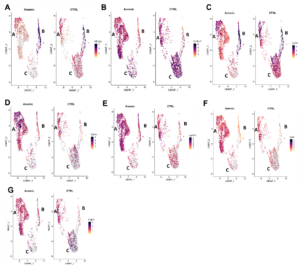
To begin determining if specific protein markers in bone marrow macrophages were associated with EBI macrophages, we analyzed the expression of candidate markers on EA-mac versus Single-mac using imaging flow cytometry. We selected candidate markers based on their differential expression between steady-state and anemia in single-cell RNA-Seq datasets for macrophages (Fig. 1). These included: major histocompatibility complex class II (MHCII), CX3C motif chemokine receptor 1 (Cx3cr1), CD74, CD14, CD9, CD16, and Galectin-3 (LGALS3). Based on the UMAP plots of scRNA analysis, our lab grouped macrophages into three superclusters, A, B, and C (Figure 1). We observed more macrophages expressing MHCII and Cx3cr1 in cluster A in anemic mice than in steady-state mice and fewer macrophages in cluster C (Fig. 1). This is also true for other markers (Fig. 1). Therefore, our lab hypothesized that the cells in cluster A are EA-mac, which tend to serve as “nurse” cells and support erythropoiesis by interacting with erythroid cells for the recovery from anemia.
Figure 1. scRNA analysis on various markers in A, B, and C superclusters. Uniform Manifold Approximation and Projection (UMAP) plots are presented for (A) MHCII, (B) Cx3cr1, (C) CD74, (D) CD14, (E) LGALS3, and (F) CD9 (G) CD16.
Analysis of macrophages in murine bone marrow samples
In preparing Single-mac and EA-mac, we applied StemCell Collagenase and DNase I to dissociate and separate Single-mac from other cells in the bone marrow samples from femurs of steady-state and anemic mice. As a result, we captured more clumps in EA-mac samples than Single-mac samples because EA-mac did not receive the treatments and did not dissociate as strongly. This was intentional, as we aimed to acquire macrophages associated with erythroid cells or other cells for EA-mac samples, and our strong dissociation treatments would break the adhesion between them in Single-mac samples. To study all the markers indicated by scRNA analysis, we stained the cells with specific antibodies that exhibit fluorescence and ran them through an imaging flow cytometer to prospectively look at their expression in Single-mac and EA-mac. We collected 250,000 cell events for each sample within an experiment, either for Single-mac or EA-mac, and the image data was exported into IDEAS software.
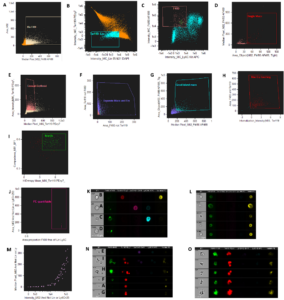
We applied IDEAS software to exclude unwanted images or cells and selected the proper images that contained our macrophages of interest for further analysis. This required applying a gating strategy as follows: first, a common gating for Single-mac and EA-mac selected cells of certain sizes and with certain signals of the F4/80 macrophage marker (Figure 2A). Then, for Single-mac gating, the first specific gate after the common gating excluded cells containing high levels of the Ter119 erythroid cell marker to ensure were single macrophages without attaching to erythroid cells and cells that have low signals for other immune cells, such as CD3 (T cells), CD19 (B cells), Ly6G (neutrophils), CD170 (eosinophils) (Figure 2B). The next gate excluded macrophage images containing high levels of immune cell signals Ly6C and low levels of F4/80 for further purification (Figure 2C). Finally, we selected cells with a certain level of F4/80 signal covering a specific area, indicating Single-mac (Figure 2D).
Figure 2. Gating strategy for imaging cytometry analysis of macrophage cells in murine bone marrow in IDEAS software. (A) Common gating for Single-mac and EA-mac. (B-D) Gating specific for Single-mac (E-I) Gating specific for EA-mac. (J&M) Common gating and analysis for the cells with quantifiable PE signals. (K) Example cells excluded by Single-mac gating. (L) Cells ultimately selected by Single-mac gating strategy. (N) Example cells excluded by EA-mac gating. (O) Cells ultimately selected by EA-mac gating strategy.
For the selection of EA-mac, the first specific gate for EA-mac samples after the common gating selects macrophages with a sufficient amount of erythroid cells by excluding cells with a low level of the Ter119 erythroid cell marker (Figure 2E). The next gate excludes events where the Ter119 signal overlaps excessively with the F4/80 signal, which might interfere with the analysis (Figure 2F). Then the next gating selects the cells with a certain level F4/80 signal which cover a certain amount of area, indicating good island macrophages (Figure. 2G). The next gate excludes events that contain erythroid cells not touching macrophages because they were not good erythroblastic islands (Figure 2H). The gating shown in Figure 2I excludes events that contain cells diffuse next to macrophages and erythroid-associated islands by looking at entropy and compactness features. We utilized various mathematical methods to quantify variance in pixel intensity patterns and contrasts, known as texture features. The feature finder program identified compactness and entropy as the most effective features for distinguishing islands from events with diffused cells.
After the Single-mac or EA-mac’s specific gating, another common gating for both samples selects the macrophage cells that are good for the quantification of PE signals, which are the signals for markers, by excluding signals that are out of focus (Figure 2J). For the ultimate feature to measure expression levels of different markers with PE signals, we had two options – intensity or median pixel. The value of the “intensity” feature represents the total average fluorescence intensity of the area, but the cells would have different sizes and the size of the cells can determine the signal value by applying the “intensity” feature. In contrast, the “median pixel” will give us the average intensity within any specific area, and we can normalize the intensity for different sizes of cells. Thus, the median pixel is a better choice. Finally, PE signal quantification was applied to PE quantifiable populations by looking at the “intensity” feature at the X-axis and “median pixel” feature at the Y-axis (Figure 2M). Good examples in PE quantifiable populations are demonstrated in Figure 2L for Single-mac and Figure 2O for EA-mac.
Expression analysis in steady-state and anemic mice
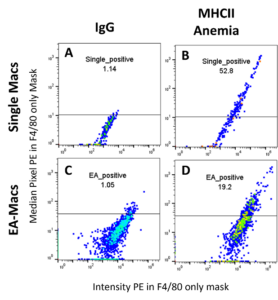
To present the complex data more clearly, we extracted the “intensity” and “median pixel” features values of channel 2 from the PE quantifiable population to determine the expression of protein markers to create FSC files. These feature values were collected on the mask of F4/80, which is the macrophage marker, and this means the feature values were only collected from macrophages and not from other cells beside them. We then analyzed these FSC files using FlowJo v10 software by plotting, with “intensity” as the X-axis and “median pixel” as the Y-axis. By using the signals from IgG samples as a negative signal reference, we established gating for positive signals of each sample (Figure 3). Since the cells with signals above the IgG gating should express positive signals, we then applied the gating to samples with marker expression to determine the proportion of cells with positive signals (% Positive) (Fig. 3).
Figure 3. Expression analysis and gating strategy in FlowJo v10 software. In each plot, the X-axis represents the “intensity” feature values, while the Y-axis represents the “median pixel” feature values. (A) Expression of IgG in Single-mac for anemic mice. (B) Expression of MHCII in Single-mac for anemic mice. (C) Expression of IgG in EA-mac for anemic mice. (D) Expression of MHC II in EA-mac for anemic mice.
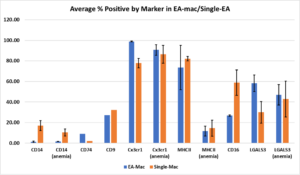
We analyzed all the “intensity” and “median pixel” feature values from the results of every experiment to all of the protein markers by composing the graphs shown in Figure 3. For a better demonstration, we utilized the values from the graphs to create a bar chart showing the average proportion of cells expressing positive signals of a certain marker with the standard error of the mean (SEM) values as error bars (Figure 4). The results for the steady-state mice showed that CD9 has similar expression levels in Single-mac and EA-mac, while CD74 had higher expression levels in EA-mac than Single-mac (Fig. 4). CD14 displayed higher expression levels in Single-mac than in EA-mac for both steady-state and anemic mice.
Figure 4. Bar chart which shows the average proportion of Single-mac or EA-mac with positive signals for expression analysis of various markers in macrophages from either steady-state or anemic mice. The markers include CD14, CD16, CD74, CD9, Cx3cr1, LGALS3 (steady-state), Cx3cr1 (anemia), MHCII (steady-state), and MHCII (anemia). The markers without specifying “anemic” were for steady-state mice. Error bars are indicated by the standard error of the mean (SEM) values.
For steady-state mice, Cx3cr1 showed more cells with positive signals in EA-mac than in Single-mac (Fig. 4). Compared to anemic mice, the proportion of Single-mac with Cx3cr1 expression increased (Fig. 4). For steady-state mice, average MHCII expression was higher in Single-mac than in EA-mac, but the wide error bars indicate an insignificant difference (Fig. 4). MHCII expression levels in both Single-mac and EA-mac become lower for anemic mice, with no significant difference observed between the two cell types (Fig. 4). The cells demonstrated higher expression levels of CD16 in Single-mac than EA-mac in steady-state mice. For LGALS3, there was no significant difference in expression between Single-mac and EA-mac for anemic mice, but the expression levels are higher in EA-mac than Single-mac for steady-state mice.
Discussion
scRNA analysis of macrophage cells in the bone marrow for both steady-state and anemic mice suggests that the macrophages can be grouped into three superclusters of macrophages. Our lab generated a hypothesis that the macrophages in cluster A are EA-mac that can support erythropoiesis better than the overall macrophages. The main purpose of this project is to explore various markers and determine if these markers can help classify macrophages between these superclusters and hope to study the role of molecular markers in macrophages during steady-state and with blood disorders, such as anemia. As the examples of cells excluded and selected by the gating strategy in IDEAS shown in Figure 2, our gating strategy successfully identified Single-mac and EA-mac with quantifiable PE signals that indicate the expression of these markers. Therefore, our data analysis based on the “median pixel” feature values of PE signals from the selected cells should be valid.
MHCII plays a crucial role in the immune functions of macrophages, particularly in the context of antigen presentation and the activation of adaptive immune responses.9 Lower expression levels of MHCII expression were observed in anemic mice compared to steady-state mice (Fig. 4). This suggests that macrophages in anemia might tend to reduce some immune function and participate more in other roles, such as supporting erythropoiesis to produce more RBC for the recovery of anemia.
CX3CR1, a receptor for the chemoattractant cytokine CX3CL1, is integral in modulating inflammatory responses, encompassing the phenotype and functionality of macrophages.10 However, while detailed information specifically relating to erythropoiesis was not immediately evident, the general understanding is that Cx3cr1-expressing macrophages have diverse functions in the immune system and may contribute to hematopoietic processes in the bone marrow.11 Given the higher expression of Cx3cr1 in EA-mac compared to Single-mac in steady-state mice (Fig. 4), Cx3cr1 has the potential to serve as a good candidate for classifying cells between Single-mac and EA-mac. Since there are significantly more cells expressing Cx3cr1 in cluster A of anemic mice compared to those in steady-state mice, it might also help classify macrophages among the three superclusters as well (Fig. 1).
More cells demonstrated positive signals of CD14 in Single-mac than EA-mac for both steady-state and anemic mice (Fig. 4). Because a larger number of cells express CD14 in cluster A of anemic mice compared to steady-state mice, CD14 could be a suitable marker for classifying macrophages among the three superclusters (Fig. 1). A greater proportion of cells expressed positive signals of CD16 in steady-state mice. However, because we didn’t access its expression for anemic mice, we could not conclude its potential roles in macrophage classification and erythropoiesis promotion. LGALS3 demonstrated similar expression levels for anemic mice since the error bars overlap, but higher levels in EA-mac for steady-state mice (Fig. 4). This result interestingly contradicts our hypothesis that the cells in cluster A are EA-mac as scRNA data also shows a higher expression in cluster A for anemic mice but the results showed a lower expression (Fig. 1). We plan to test the interior expression of LGALS3 using cell fixation and cell permeabilization kit in the future to verify consistency of the results. Moreover, since CD9 failed to show a significant difference in expression levels for both Single-mac and EA-mac (Fig. 4), no significant conclusions can be drawn from it.
For limitations, we did not have enough valid, repeated trials for CD74, even though it actually demonstrates a difference in expression levels in Single-mac and EA-macs. Therefore, it is not possible to draw reliable conclusions from CD74 with only one trial for steady-state mice, but it would be interesting to investigate CD74 since its expression levels in EA-mac were much higher than Single-mac (Fig. 4). We also lacked experiments to test CD74 and CD16 markers for anemic mice. In addition, the strand errors for the expression signals of small markers are large. Therefore, we plan to conduct more experiments with CD74 and CD16 and other markers for both steady-state and anemic mice. Additionally, we set the IgG gating to subjectively select cells with positive expression signals in our graphs composed using Flowjo. The gating was not set above all signals in IgG samples but actually included a very small proportion of cells, around 1-2%, with IgG signals (Fig. 3). These cells are outliers that separate from the general IgG population with relatively high signals, so we decided to not consider them when creating the IgG gating. However, it may be biased to draw conclusions based on our subjective IgG gating.
Even though the data on expression levels can help us suggest the potential role of these factors in anemia and in the classification of macrophages, further cellular experiments are essential for more comprehensive conclusions. These could include immunohistochemistry to confirm the expression of genes by macrophages physically associated with erythroblasts and functional tests of macrophages in tissue culture. Furthermore, we plan to isolate macrophages with high expression of certain protein markers by using cell sorting and coculture them with erythroid progenitors to test the potential roles of markers in the promotion of erythropoiesis. By conducting cellular experiments with isolated macrophages and erythroid cells in the future, we hope to gain insights into their interaction and its impact on erythropoiesis or recovery from blood disorders such as anemia.
References
- Klei, T. R., Meinderts, S. M., van den Berg, T. K., & van Bruggen, R. (2017). From the Cradle to the Grave: The Role of Macrophages in Erythropoiesis and Erythrophagocytosis. Frontiers in immunology, 8, 73. https://doi.org/10.3389/fimmu.2017.00073
- Zivot, A., Lipton, J. M., Narla, A., & Blanc, L. (2018). Erythropoiesis: insights into pathophysiology and treatments in 2017. Molecular medicine (Cambridge, Mass.), 24(1), 11. https://doi.org/10.1186/s10020-018-0011-z
- Seu, K. G., Papoin, J., Fessler, R., Hom, J., Huang, G., Mohandas, N., Blanc, L., & Kalfa, T. A. (2017). Unraveling Macrophage Heterogeneity in Erythroblastic Islands. Frontiers in immunology, 8, 1140. https://doi.org/10.3389/fimmu.2017.01140
- Hom, J., Dulmovits, B. M., Mohandas, N., & Blanc, L. (2015). The erythroblastic island as an emerging paradigm in the anemia of inflammation. Immunologic research, 63(1-3), 75–89. https://doi.org/10.1007/s12026-015-8697-2
- Manwani, D., & Bieker, J. J. (2008). The erythroblastic island. Current topics in developmental biology, 82, 23–53. https://doi.org/10.1016/S0070-2153(07)00002-6
- Ramos, P., Casu, C., Gardenghi, S., Breda, L., Crielaard, B. J., Guy, E., Marongiu, M. F., Gupta, R., Levine, R. L., Abdel-Wahab, O., Ebert, B. L., Van Rooijen, N., Ghaffari, S., Grady, R. W., Giardina, P. J., & Rivella, S. (2013). Macrophages support pathological erythropoiesis in polycythemia vera and β-thalassemia. Nature medicine, 19(4), 437–445. https://doi.org/10.1038/nm.3126
- Liu, X. S., Li, X. H., Wang, Y., Shu, R. Z., Wang, L., Lu, S. Y., Kong, H., Jin, Y. E., Zhang, L. J., Fei, J., Chen, S. J., Chen, Z., Gu, M. M., Lu, Z. Y., & Wang, Z. G. (2007). Disruption of palladin leads to defects in definitive erythropoiesis by interfering with erythroblastic island formation in mouse fetal liver. Blood, 110(3), 870–876. https://doi.org/10.1182/blood-2007-01-068528
- P Furmanski, CS Johnson; Macrophage control of normal and leukemic erythropoiesis: identification of the macrophage-derived erythroid suppressing activity as interleukin-1 and the mediator of its in vivo action as tumor necrosis factor. Blood 1990; 75 (12): 2328–2334. doi: https://doi.org/10.1182/blood.V75.12.2328.2328
- Zuo, W., Sun, R., Ji, Z., & Ma, G. (2023). Macrophage-driven cardiac inflammation and healing: insights from homeostasis and myocardial infarction. Cellular & molecular biology letters, 28(1), 81. https://doi.org/10.1186/s11658-023-00491-4
- Zheng, J., Yang, M., Shao, J., Miao, Y., Han, J., & Du, J. (2013). Chemokine receptor CX3CR1 contributes to macrophage survival in tumor metastasis. Molecular cancer, 12(1), 141. https://doi.org/10.1186/1476-4598-12-141
- Burgess, M., Wicks, K., Gardasevic, M., & Mace, K. A. (2019). Cx3CR1 Expression Identifies Distinct Macrophage Populations That Contribute Differentially to Inflammation and Repair. ImmunoHorizons, 3(7), 262–273. https://doi.org/10.4049/immunohorizons.1900038
About the Author
My name is Xupei Ou, and you can also call me Prince. I am a Molecular Genetics major from the class of 2024. Currently, I am working in Dr. James Palis’s lab on the interaction between macrophages and erythroid cells, and I also have long-term research experience in microbiology and genetics. My current interest mainly focuses on the molecular basis of diseases, such as blood disorders. I believe that by elucidating the mechanisms governing disease occurrences at cellular and molecular levels, we will gain a better understanding of the diseases and be able to develop proper medical strategies against them.
Cite this Article
Ou, X., McGrath, K., Kingsley, P., Palis, J. (2024). Investigating the Interaction between Macrophages and Erythroid Cells in Bone Marrow: Implications for Erythropoiesis and Anemia. University of Rochester, Journal of Undergraduate Research, 22(2). https://doi.org/10.47761/JZYM6125
JUR | Creative Commons Attribution 4.0 BY International License


