Neuroscience
Diurnal Relocalization of the Extracellular Matrix Component Brevican in Perineuronal Nets
Spring 2025, Volume 23, Issue 2
Isaac Morse ’26, Lauren Hablitz*
DOI: 10.47761/VXIM6846
Abstract
Perineuronal Nets (PNNs) are specialized structures of the extracellular matrix (ECM) that localize tightly around specific types of neurons, providing structural support, altering membrane potential, and regulating synaptic transmission. PNNs have been shown to rapidly degrade and reappear in periods of sleep, learning, injury, and reward. Brevican (BCAN) is an important portion of the PNN and has altered levels in a variety of psychiatric diseases, models of traumatic brain injury (TBI), and glioma. However, the exact way PNNs as a whole and
BCAN specifically is modulated is a current area of research with no clear answer. This study aims to replicate previous studies showing diurnal rhythms, differences in metabolism, and transcription based on time of day, in PNNs. Along with this, we shed light on whether or not degradation and reappearance of PNNs is a complete breakdown and resynthesis, or simply a relocalization of building blocks from the ECM.
Introduction
The extracellular matrix (ECM) is a web of proteoglycans and other molecules that spans the space between cells. In the central nervous system, perineuronal nets (PNNs) are condensed portions of the ECM that surround neurons, only leaving gaps for synaptic transmission. A PNN has three main parts: the cell adhesion molecules which orient it properly and connect it to cells, the hyaluronic backbone which makes up most of the structural portion of the web, and the chondroitin sulfate proteoglycans (CSPGs) which have the most interaction with the extracellular fluid (ECF) and other neurons (Testa et al. 2019). CSPGs exercise a multitude of functions: physical barriers for toxins, ion reservoirs for repeat firing, and regulators of synaptic formation and transmission. PNNs are most commonly found around fast-spiking GABAergic parvalbumin (PV) expressing neurons, which are critical for plasticity regulation and are implicated in learning processes related to reward, fear, and addiction (Thamyris Santos‐Silva et al. 2024). The presence of PNNs is known to stabilize and protect new synapses; however, they are also largely inhibitory towards new axonal growth because of the anionic nature of hyaluronan and CSPGs (Testa et al. 2019). This allows PNNs, based on location and time of presentation, to selectively consolidate certain connections while preventing others from being made (Reichelt et al. 2019).
Brevican (BCAN) is a neural CSPG of the PNN that has been implicated in multiple relationships with fear and reward learning, tumor invasiveness, and a number of psychiatric disorders. BCAN is unique within the family of lecticans for its association with axon initial segments (AIS) and the nodes of Ranvier (NoR). Here, BCAN acts as a building point for certain other CSPGs (Frischknecht and Seidenbecher 2012). This allows the presence of BCAN to alter when the PNN forms and PNN structural completeness.
In relation to tumors, high quantities of proteolytically processed BCAN lead to increased invasiveness of all manners of glioma in a reversible fashion. The addition of BCAN has been shown to allow some tumor cells to become invasive with the inhibition of certain proteolytic enzymes preventing this change (Zhang et al. 2024).
BCAN has also been implicated in a number of psychiatric disorders including Alzheimer’s, schizophrenia, depression, and addiction. BCAN has been found in higher quantities in depressive and schizophrenic patients and in varying quantities at different parts of addiction formation and extinction. Increased quantities of specific BCAN cleavage-fraction BCAN2 are found following initial exposure to cocaine while whole BCAN relocation away from the synapse is found in mice 3 weeks abstinent from heroin self-administration (Peeters and Grueter 2024, Van den Oever et al. 2010). Total knockout of BCAN is also related to increased motivation for novel learning which led to quicker formation of addiction behavior in mice (Peeters and Grueter 2024). This indicates a possible modulating effect of BCAN as seen with PNNs above, wherein not only different timing of BCAN accumulation but also different splicing leads to different functionalities. Overall, this leads to questions about the temporal regulation of BCAN and on what schedules BCAN is removed or placed and in which forms.
Circadian rhythms are 24-hour endogenous cycles of transcription and translation regulating processes such as the cell cycle and metabolism. These cycles are alterable by environmental and behavioral entrainment and have been shown to change both as a cause and result of certain pathologies (Edery 2000). Previous studies have shown varying degrees of circadian influence on many processes BCAN appears to play a role in. Circadian effectors such as melatonin have been shown to block or reduce tumor metastasis in a dose-dependent relationship (Greene 2012). Different knockouts of core circadian genes result in increased sensitivity or inability to sensitize to cocaine leading to differential rates of addiction in mice with different circadian disruptions (Becker-Krail and McClung 2016). Multiple psychiatric disorders already discussed such as schizophrenia and depression have alterations to their sleep/wake cycles and possible circadian rhythms to their symptomatology (Costa et al. 2013, Meyer et al. 2020). Two previous studies have also already shown that PNNs as a whole appear and disappear on circadian rhythms and/or with diurnal control (Pantazopoulos et al. 2020, Harkness et al. 2021). This study aims to replicate that data and specify this idea to BCAN alone, while also discussing whether the altered quantities of BCAN and PNNs are results of degradation and resynthesis or simple movements back and forth from the ECM.
Methods
Animals
5 male and 5 female adult (8-9 weeks old) C57BL/6 mice (18-35g, University of Rochester Medical Center) were housed in temperature and humidity-controlled rooms with 12:12 light/dark cycles. 5 male and 5 female Bmal1 mice were also used for data. CAG-Cre+ and Bmal1f/f were obtained from The Jackson Laboratory (Bar Harbor, ME); all mice were backcrossed at least 10 generations with a C57BL/6 background under the same conditions as WT mice. Cre+Bmal1f/f mice were bred with Bmal1f/f mice so offspring would be an equal mix of Cre+ and Cre- Bmal1f/f background. Littermates were used for this experiment with 2 male Cre+ and 3 female Cre+ mice being obtained. All Bmal1f/f mice were treated with tamoxifen (Sigma, dissolved in corn oil, 1mg/mouse/day for 10 days) by injection at 1-2 months to cause Bmal deletion. All mice were group housed within genotype and provided ad libitum access to food and water. All experiments were approved by the University of Rochester Medical Center Committee on Animal Resources.
Anesthetics and Enucleation
100mg/kg-1 racemic ketamine and 20mg/kg-1 xylazine kg (KX) were administered via intraperitoneal (IP) injection 10 minutes before the beginning of the experimental ZT. The efficacy of the KX was determined by a pedal-reflex test. If the subject responded to a toe pinch, another 0.02mL of KX was given until non-responsive. To eliminate the chance of light pulses, all mice in this experiment were enucleated using simple curved scissors before perfusion. All enucleations were performed after additional pedal-reflex tests and, for the night timepoints, were completed before being re-exposed to light.
Immunohistochemistry (IHC)
Mice were cardiac-perfused with 20mL of PBS followed by 20mL of 4% paraformaldehyde (PFA) at ZT6 or ZT18. Brains were harvested and sliced 100µm thick after a night spent in 4% PFA. Slices were washed in PBS 3 times for 10 minutes each before being washed for 1 hour in a blocking solution containing 10% Normal Donkey Serum, 0.5% Triton-X-100, and 0.3% Fab (AffiniPure F(ab’)2 Goat Anti-MouseIgG, lot155236, Johnson ImmunoReseach) in PBS gelatin. Slices were washed 3 times more in PBS before being incubated overnight in the proper primary antibody (1:600, rabbit anti-brevican, lot9F26ST1, Novus Biologicals) then washed 3 times more in PBS and submerged in secondary antibody solution (1:600, donkey anti-rabbit Cy5, lot8P98QR4, ThermoFischer, 1:2000, DAPI, Invitrogen) for 1 hour and washed a final 3 times in PBS before being plated.
Imaging and Quantification
Brain slices were imaged using a confocal (Confocal Laser Scanning Microscope FV4000, Olympus Life Sciences) to take pictures of the dorsal cortex layers 4 and 5, the Ca1 of the hippocampus, the dorsal and ventral aspects of the suprachiasmatic nucleus and layers 4 and 5 of the visual cortex. Pictures were taken using both 20x (no zoom, 1024×1024 pixels, 0.9µm steps) and 40x objectives (4.69 zoom, 512×512 pixels, 0.6µm steps). 20x images were taken of the entire Z stack while 40x images followed a single grouping of neurons for each photo. PNNs were counted by hand on 20x photos after maximum intensity projection, “Median” (2 pixel) filtering and “Otsu” Thresholding in ImageJ to remove the background and uncondensed ECM. A single PNN was characterized as being globular in nature with an 8-17 pixel diameter not bordering the edge of the image. PNNs from 40x photos were quantified by percent area covered after maximum intensity projection, “Gaussian” (1-pixel radius) filtering and Otsu Thresholding in ImageJ. ROIs for each area were drawn for each PNN on summed images of gaussian filtering with 1 and 2-pixel radii for ease of differentiation from background. All quantities were held in comparison to the total number of nuclei defined in each photo as counted manually after maximum intensity projection. Average fluorescence and thresholding values were defined as per the protocol (Slaker et al. 2016). Average fluorescence of the loose ECM was calculated by taking four 20×20 pixel ROIs of non-PNN regions with some ECM and measuring their values using the “measure” function on ImageJ. Averages were specific to each brain region and were used to set the threshold for 20x images. The threshold was set at the average for that neural region plus 2 standard deviations, indicating that everything above was to be considered as possible PNN staining.
Statistics
2 data points were collected for each mouse individually for the number of BCAN+ PNNs counted divided by the number of nuclei found in a standard area. Unpaired student’s T-tests were run using the program GraphPad Prism 9 with Welch’s corrections when needed. Groups for the student’s t test were defined as data collected from individuals sacrificed during ZT6 or ZT18. Sex and age were distributed equally amongst times.
Results
Circadian Rhythms of BCAN+ PNN Appearance in Wild-Type Mice
This experiment involved the removal of neural tissue at different time points in the diurnal rhythm to determine if BCAN+ PNNs were present in different numbers from day to night. ZT6 and ZT18 were chosen as they are antiphase to each other and represent 6 and 18 hours after first light. These times correspond to the height of sleep and activity in mice. Sagittal slices of the brain were taken to image neural regions such as the anterior and posterior Dorsal Cortex, Ca1 of the hippocampus, the Suprachiasmatic Nucleus dorsal and ventral regions, and the visual cortex. These regions were chosen because of their relation to higher judgment and certain psychiatric disorders, learning and memory, and circadian and diurnal rhythms and control respectively. All graphs represent unpaired student’s T-tests of dark vs light values of the number of BCAN+ PNNs counted divided by the number of nuclei found. 20x images were taken to get a larger sample size while 40x images were taken to determine the percent area covered by the BCAN in the PNN for a different study down the line.
Significant diurnal rhythms of PNN appearance were observed in only the 20x photos across regions of the brain. BCAN+ PNNs were found to be significantly more numerous at ZT18 in the AD (p<0.005), PD (p~0.05), Ca1 (p<0.05) with trends in the VC (p<0.15, Fig. 1). Data from 20x photos of the Suprachiasmatic Nucleus (SCN) Dorsal and Ventral regions showed no significant change from dark to light portions of the cycle (Fig. 2). All patterns observed were consistent across sexes and weights. Representative images of each region are collected below before analysis with only the background removed (Fig. 2).
40x photos returned largely non-significant findings with a trend in the Ca1 and significance in the SCN D, antiphase to what is supported by all other findings in this and previous studies (Fig. 3). All patterns observed were consistent across sexes and weights. Representative images of each region are collected below before analysis with only the background removed (Fig. 4).
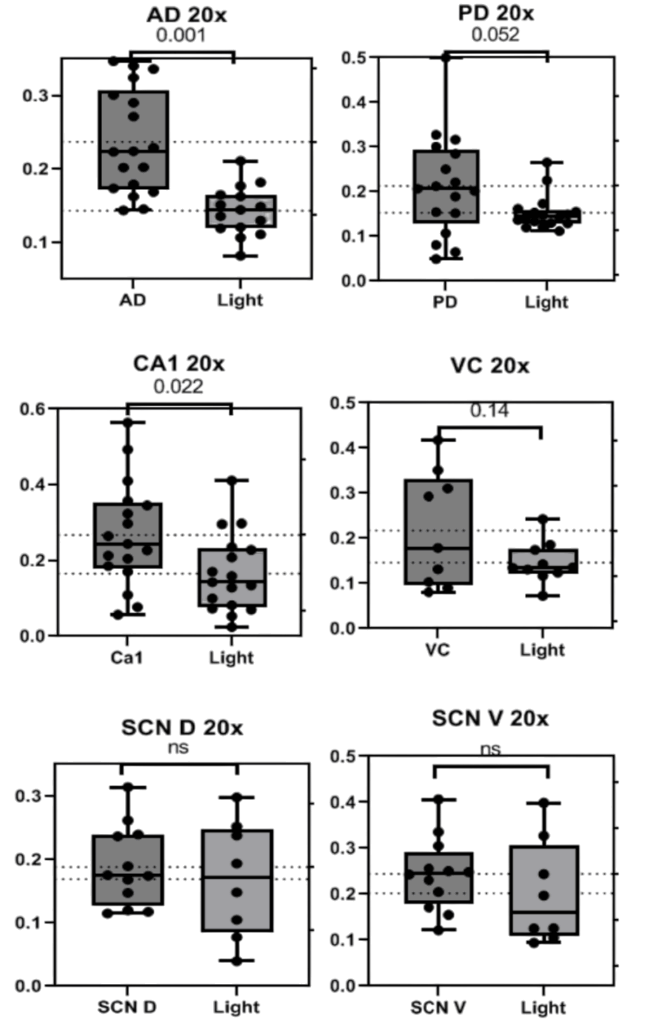
Figure 1. Graphs depicting the number of BCAN+ PNNs counted in standardized areas from 20x photos of the Anterior Dorsal Cortex (AD 20x), Posterior Dorsal Cortex (PD 20x), Ca1 of the hypothalamus (CA1 20x), Visual Cortex (VC 20X), and Suprachiasmatic Nucleus Dorsal (SCN D 20X) and Ventral (SCN V 20X) regions. Bars indicate the interquartile range and fences for Q1 and Q3 along with the mean. P values are presented above each set of data.
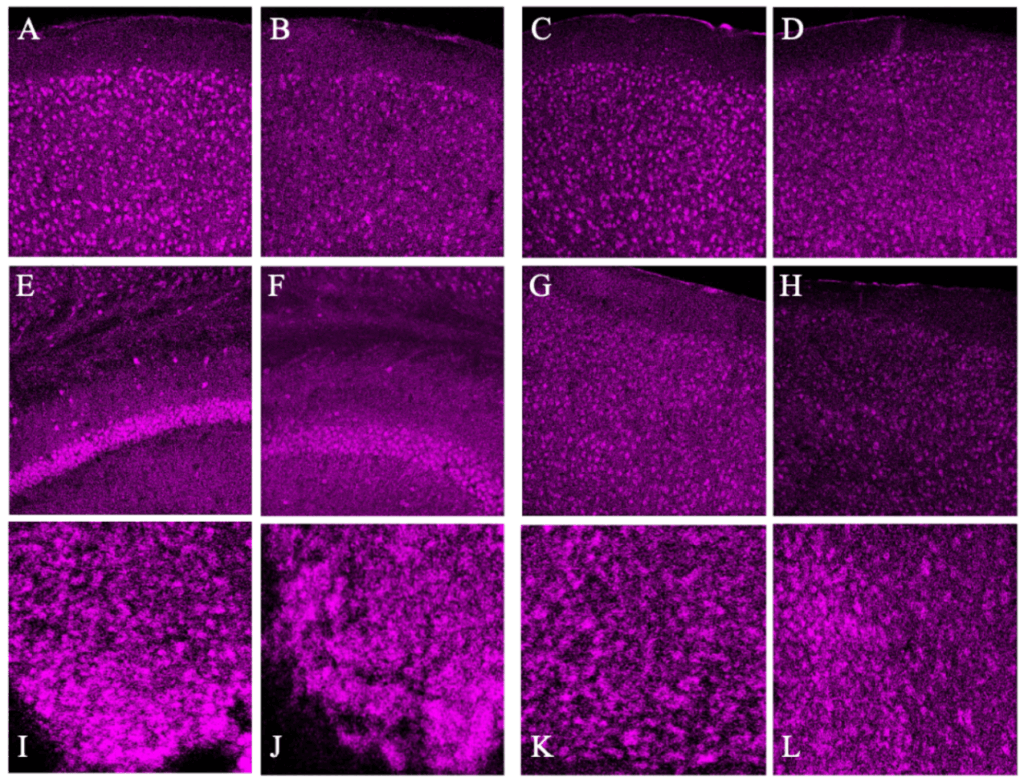
Figure 2. Representative 20x images of each brain region with dark image on the left and light image on the right: Anterior Dorsal Cortex (A&B), Posterior Dorsal Cortex (C&D), Ca1 (E&F), Visual Cortex (G&H), and SCN Dorsal and Ventral regions (I,J & K,L). These images were Z-Stacked for maximum intensity and had the background fluorescence removed.
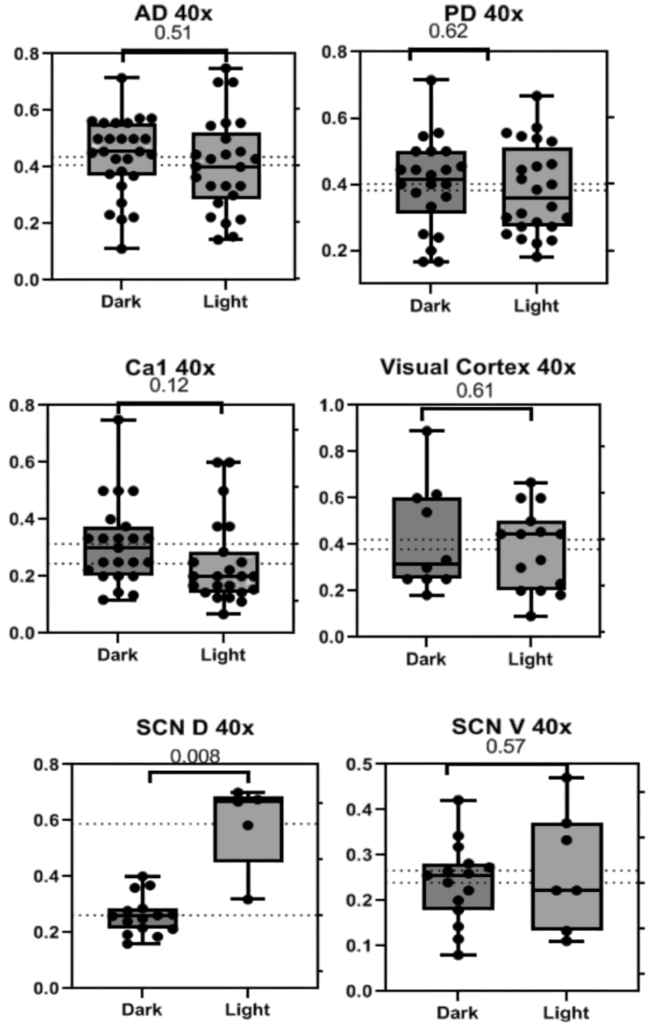
Figure 3. Graphs depicting the number of BCAN+ PNNs counted in standardized areas from 40x photos of the Anterior and Posterior Dorsal Cortex (A, B), Ca1 (C), Visual Cortex (D), Suprachiasmatic Nucleus Dorsal (E), and Ventral (F) regions. Bars indicate the interquartile range and fences for Q1 and Q3 along with the mean and dots representing data points from each specific mouse.
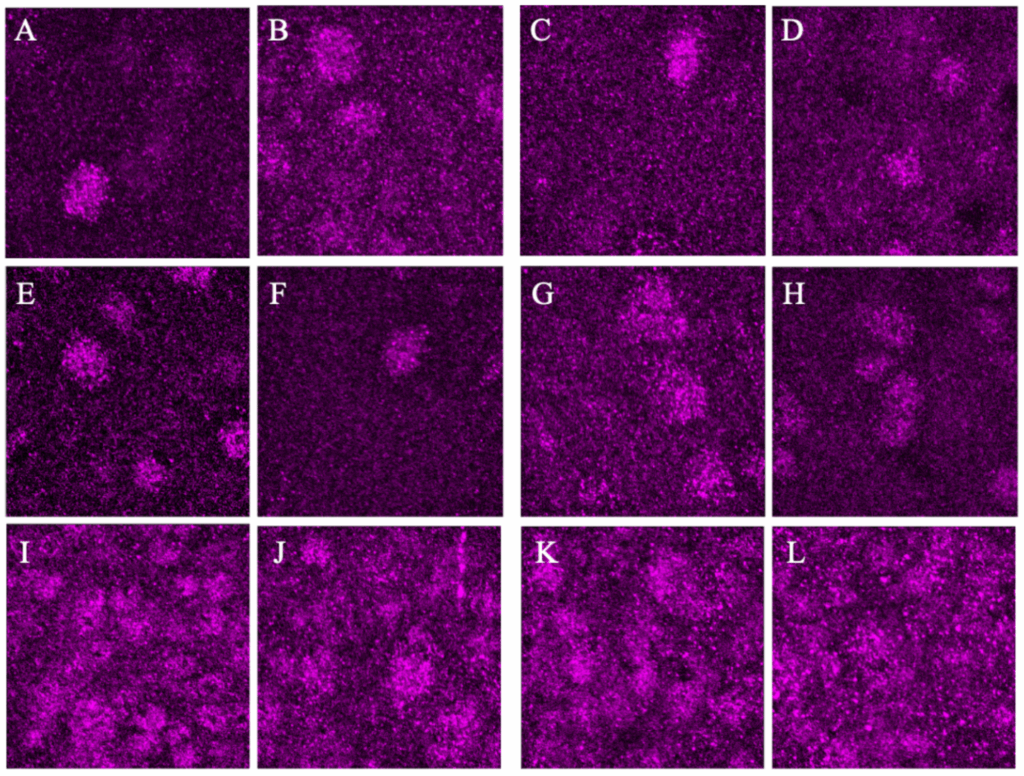
Figure 4. Representative 40x images of each brain region with dark image on the left and light image on the right: Anterior Dorsal Cortex (A&B), Posterior Dorsal Cortex (C&D), Ca1 (E&F), Visual Cortex (G&H), and SCN Dorsal and Ventral regions (I,J & K,L). These images were Z-Stacked for maximum intensity and had the background fluorescence removed.
Circadian Rhythms of BCAN+ PNN Appearances in Bmal Mice
To determine whether or not the difference in BCAN+ PNN presence is based on exogenous light cycles or endogenous circadian rhythms, Bmal –/– KO mice underwent the same procedure as C57BL/6 mice. BMAL is a transcription factor that has been proven to be heavily involved in time-base metabolic oscillations throughout the body in many organisms and Bmal –/– KO mice have been shown to have impaired or destroyed circadian rhythms (Kondratov et al. 2006). The data from 20x images in bar graphs and pictures below indicate that BCAN+ PNNs are unable to disappear and reappear through dark/light cycles without circadian intervention via the Bmal transcription factor. This pattern was present in all areas but the SCN V in 20x photos (Fig. 5&6) and all but the PD and Ca1 in 40x photos (p>0.5, Fig. 7&8).
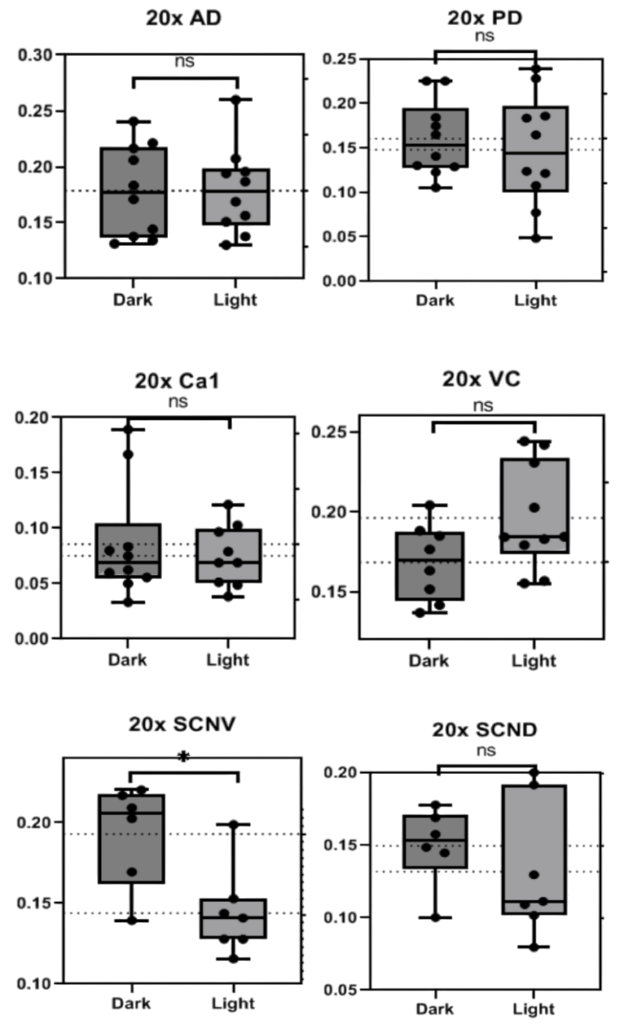
Figure 5. Graphs depicting the number of BCAN+ PNNs counted in standardized areas from 20x photos of the Anterior Dorsal Cortex, Posterior Dorsal Cortex, Ca1, Visual Cortex, and Suprachiasmatic Nucleus (SCN) Dorsal and Ventral regions of Bmal -/- mice. Bars indicate the interquartile range and fences for Q1 and Q3 along with the mean. P values are presented above each set of data.
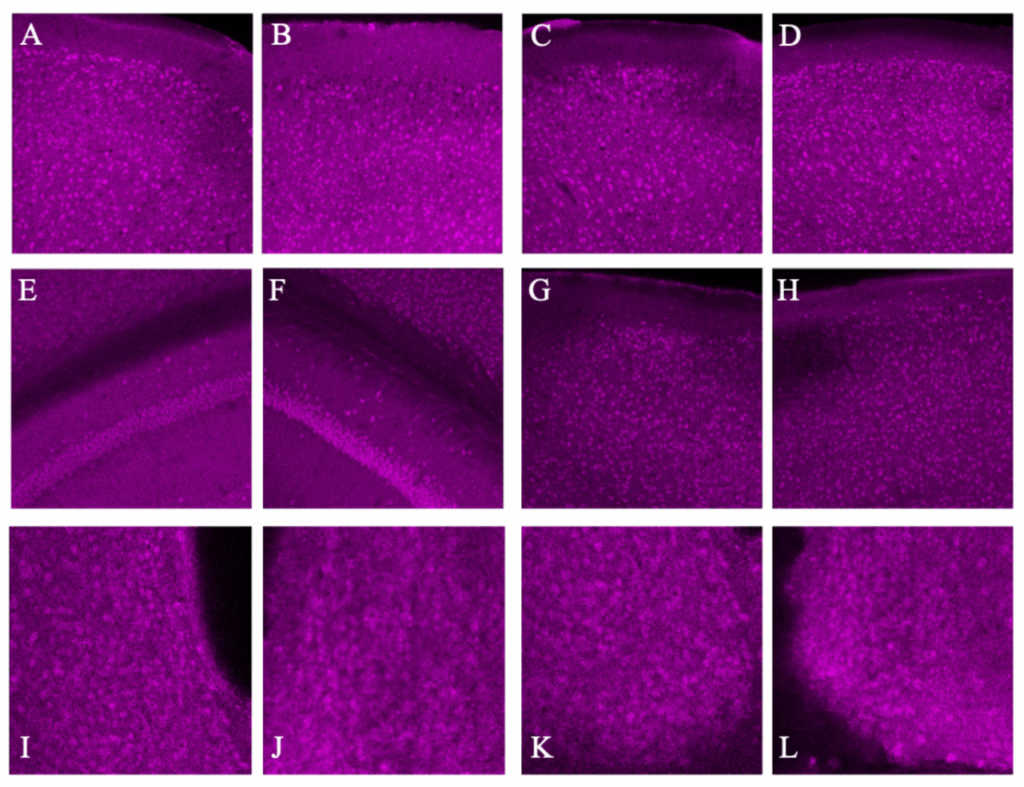
Figure 6. Representative images of each brain region with dark image on the left and light image on the right: Anterior Dorsal Cortex (A&B), Posterior Dorsal Cortex (C&D), Ca1 (E&F), Visual Cortex (G&H), and SCN Dorsal and Ventral regions (I,J & K,L). These images were Z-Stacked for maximum intensity and had the background fluorescence removed.
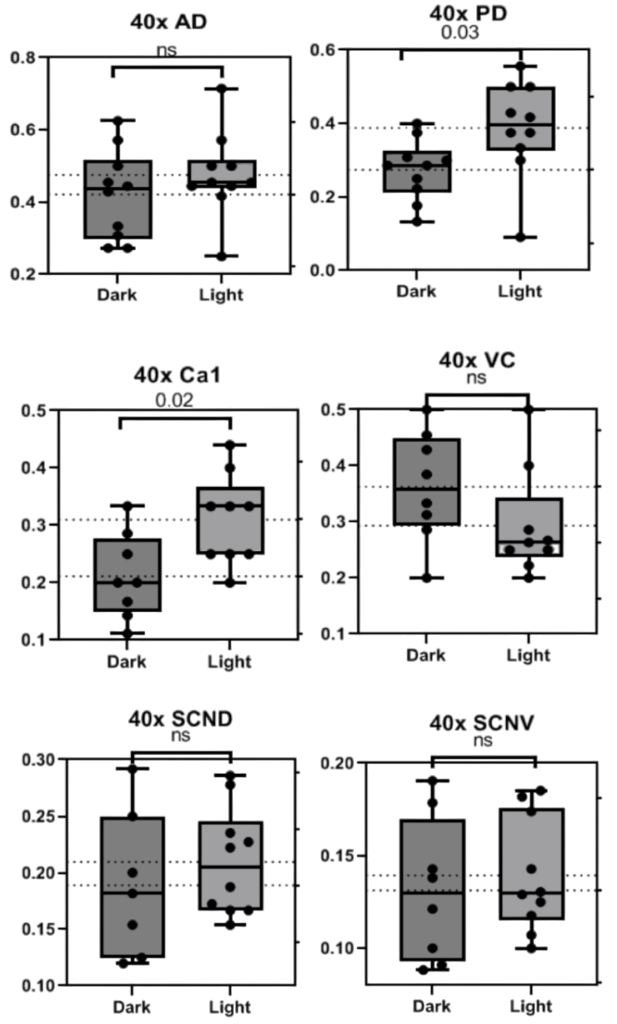
Figure 7. Graphs depicting the number of BCAN+ PNNs counted in standardized areas from 40x photos of the Anterior Dorsal Cortex, Posterior Dorsal Cortex, Ca1, Visual Cortex, and Suprachiasmatic Nucleus (SCN) Dorsal and Ventral regions of Bmal -/- mice. Bars indicate the interquartile range and fences for Q1 and Q3 along with the mean. P values are presented above each set of data.
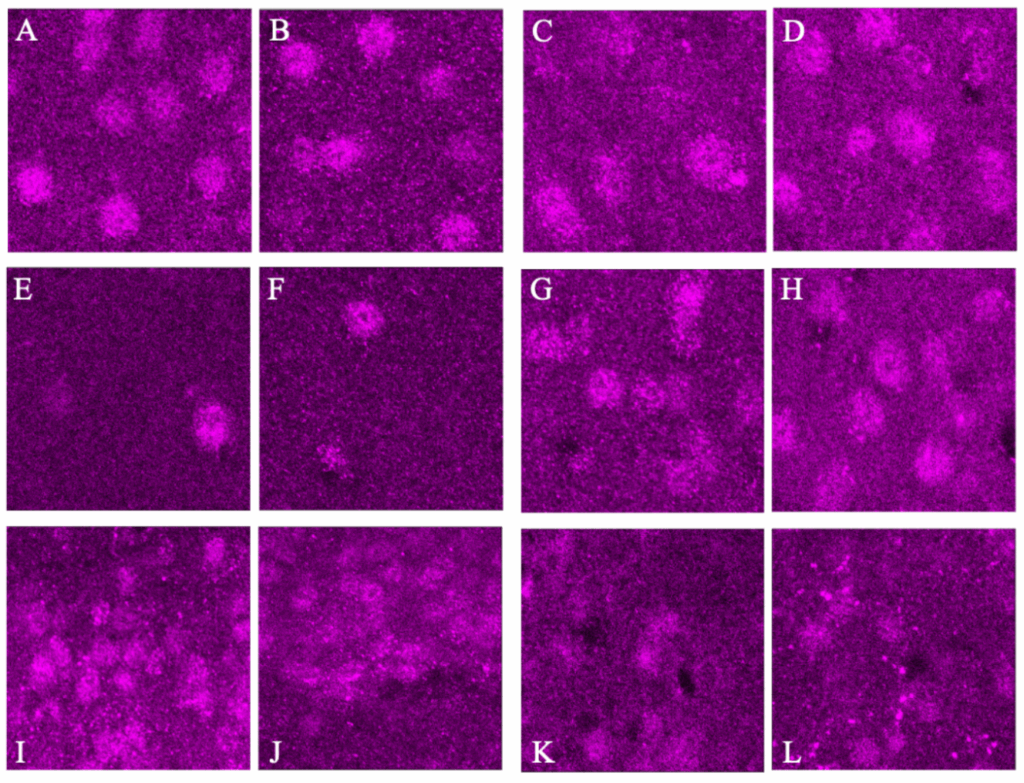 Figure 8. Representative images of each brain region with dark image on the left and light image on the right: Anterior Dorsal Cortex (A&B), Posterior Dorsal Cortex (C&D), Ca1 (E&F), Visual Cortex (G&H), and SCN Dorsal and Ventral regions (I,J & K,L). These images were Z-Stacked for maximum intensity and had the background fluorescence removed.
Delocalized non-PNN BCAN Fluorescence
To determine whether there was a difference in the quantity of “loose” ECM (BCAN not localized around a given PNN) across light cycles, average fluorescence measurements were taken of the background, which had fluorescence but was not deemed as a portion of the PNN. This data indicates whether or not the altered quantities of BCAN+ PNNs are representative of a whole degradation and resynthesis of BCAN, or a reallocation of BCAN molecules already present in the loose ECM to a PNN and vice versa. The data shows higher quantities of BCAN were found in the loose ECM during the light portion of the cycle, antiphase so when more BCAN+ PNNs were found. This pattern was present in 20x photos of the AD (p<0.005), and VC (p<0.005) with trends in the PD (p<0.15, Fig. 9). This was also seen in the 40x photos of the AD (p<0.05), PD (p<0.005), and Ca1 (p<0.005, Fig. 10).
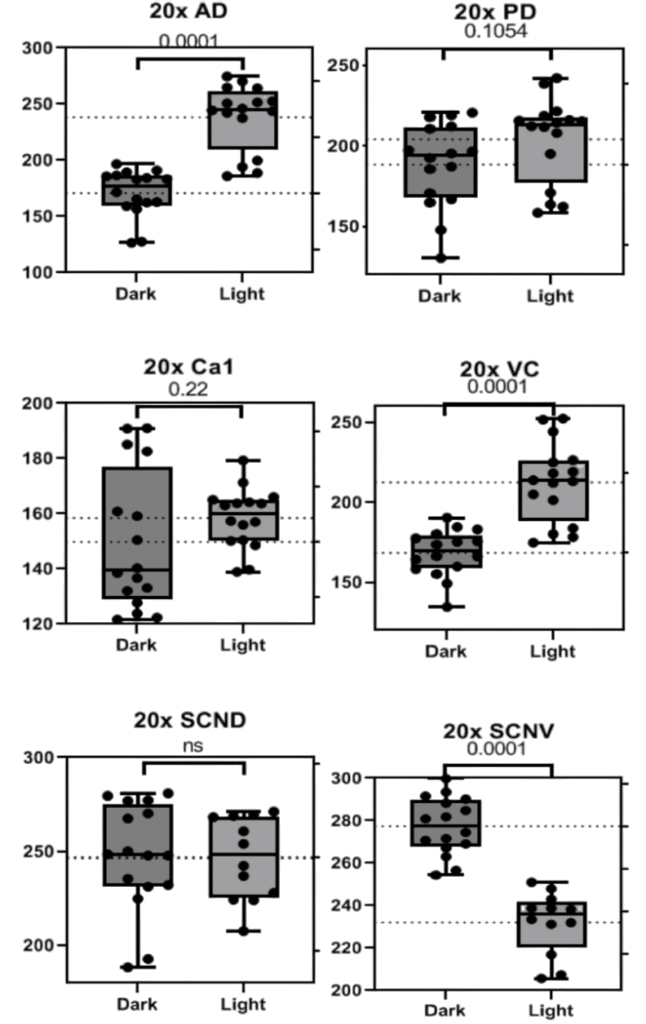
Figure 9. Graphs depicting average fluorescent values of the loose ECM taken from 20x images of the Anterior and Posterior Dorsal Cortex (A and B), Ca1 (C), Visual Cortex (D), and Suprachiasmatic Nucleus Dorsal (E) and Ventral (F) regions. Bars indicate interquartile ranges for Q1 and Q3 and the mean. P values are listed above the data sets.
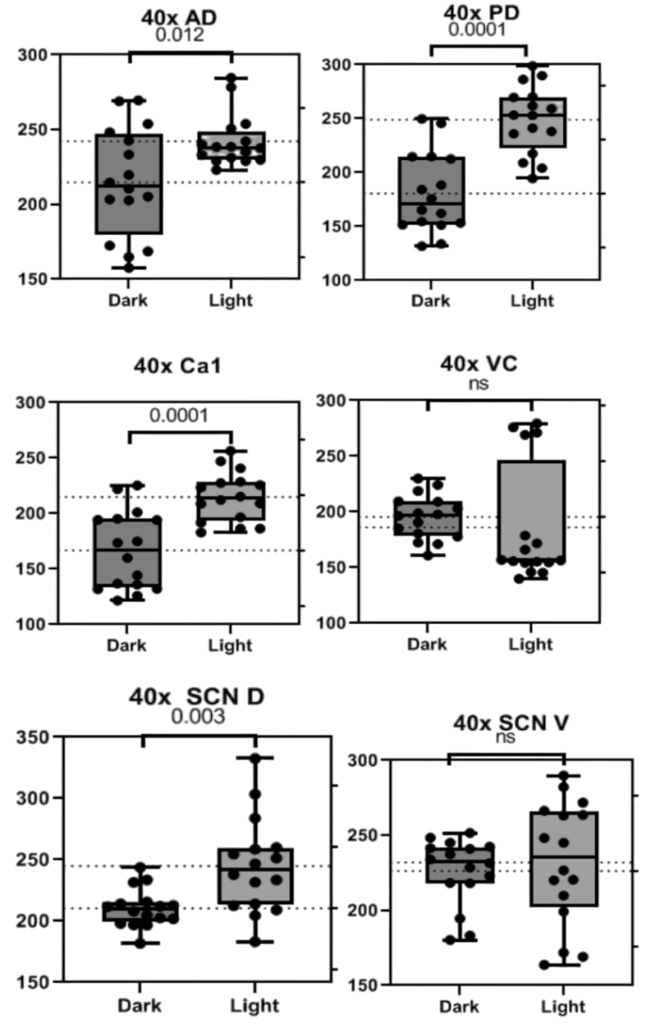
Figure 10. Graphs depicting average fluorescent values of the loose ECM taken from 40x images of the Anterior and Posterior Dorsal Cortex (A and B), Ca1 (C), Visual Cortex (D), and Suprachiasmatic Nucleus Dorsal (E) and Ventral (F) regions. Bars indicate interquartile ranges for Q1 and Q3 and the mean. P values are listed above the data sets.
Discussion
This study determined that BCAN+ PNNs vary across diurnal rhythms at ZT6 and ZT18 in a significant fashion across brain regions with few exceptions as described in technical considerations. It also asserted that there was a decreased quantity of BCAN in the loose ECM which was in phase with BCAN being present in more PNNs. This was also the first time PNNs have been shown to not vary across light cycles when their circadian rhythms are impaired. This provides more evidence that PNNs may be under circadian control and therefore, may inform how their variance is studied in the future.
The rhythms of BCAN and PNNs as a whole are important features in a number of key processes and pathologies of the brain. During sleep PNNs are degraded, allowing for synaptic pruning at synapses previously protected. During wakefulness, the number of PNNs increases to protect and strengthen new synapses. This study presents new information showing that BCAN, which is found uniquely at the axon initial segment (AIS) and nodes of Ranvier (NoR), also follows this pattern both within and outside of PNNs and may be contributing to these processes. Mice lacking BCAN have been shown to be unable to maintain long-term potentiation (LTP) and thereby are less able to form new connections and habits (Cord Brakebusch et al. 2002). The fact that BCAN+ PNNs follow the rhythm of LTP and other PNNs as a whole lends support to the idea that PNNs and BCAN are involved in memory consolidation and LTP. Along with this, the diurnal rhythms of BCAN in the loose ECM may be indicative of the role BCAN plays in the nodes of Ranvier (NoR). Higher quantities of BCAN in the loose ECM during wakefulness may represent a strengthening of connections at the nodes with BCAN possibly acting as an ion repository. Less BCAN during rest may destabilize the nodes and allow for easier pruning of axons. More time should be devoted to determining when BCAN begins to appear as it is often discussed as one of the first components of PNNs. Does BCAN begin to cluster around neurons hours before the rest of the PNN or mere minutes? When BCAN is altered via proteolytic cleavage do the same results appear as a total knockout of the protein? Can placement of BCAN be impacted by sleep deprivation or other disruptions of circadian rhythms and does this affect LTP during sleep?
The alternating of BCAN quantities and locations may also be used to explain or understand certain psychiatric disorders. In the case of addiction, a possible mechanism for the formation of extreme reward circuits and maladaptive behavior lies in the regulation of parvalbumin-expressing interneurons (PVINs) which also are the most prominent type of cell covered by PNNs (Reichelt et al. 2019). PVINs are GABAergic neurons that coordinate a feed-forward response inhibiting certain neural ensembles when stimulation occurs. In non-disease states, this leads to a higher specificity of response but with disruption of the PVINs, many more groups of neurons can be activated than normal. In the Nucleus Accumbens (NAc), a key reward circuit in the brain, PVINs see a sharp increase in the number of PNNs surrounding them throughout development and maintained even in adulthood (Peeters and Grueter 2024). When knockdown of BCAN mRNA occurs, these PNNs are destabilized and fewer excitatory puncta are present on PVINs, leading to less inhibition of the reward circuits. Following psychostimulant exposure, more BCAN degrading enzymes are activated and significant impairment of the PVINs was seen. In mice, both of these events led to addictive behaviors being acquired more quickly in response to cocaine. Further study into this phenomenon must be conducted (Peeters and Grueter 2024). If BCAN is relocated at different times of day, this may lead to a destabilizing effect on NAc PVINs allowing for increased chances of addiction. Furthermore, PNNs are known to begin appearing mostly during adolescence when individuals are also at a higher risk of addiction. Since BCAN arrives before PNNs to favor connection of the PNN to the cell (Frischknecht and Seidenbecher 2012), differential quantities of it may also prove to be a risk factor for addiction in adolescents as fewer/weaker PNNs form. Further study into the molecular mechanisms that underlie the relocation of BCAN may allow for treatments to be developed for preventing addiction for those at risk or helping to decrease the chance of relapse in those already struggling with substance abuse.
The rhythms of BCAN may also be relevant to the study of tumor invasiveness. Many cell cycle genes are under circadian control and a number of tumor cells are found to have mutated sequences or altered regulation of clock genes. A plethora of methods for disrupting circadian rhythms have been shown to accelerate tumor growth in cancers, from osteosarcoma to mammary adenocarcinomas, and treatment for such cancers is affected by what place in the circadian rhythm treatments are provided (Greene 2012). BCAN itself has also been shown to have a role in the invasion and growth of cancers. BCAN is overexpressed in invasive tumor cells and its cleavage is required for a proper acceleration of invasive properties (Zhang et al. 2024) with previous studies showing that the cleavage of PNNs as a whole may also be under circadian control (Pantazopoulos et al. 2020). The discovery that BCAN follows these rhythms both in PNNs and the loose ECM may allow for more targeted treatments to be developed. However, with the new information that BCAN may just be moved around in the ECM rather than destroyed and remade, efforts must be made to determine how and if this movement actually occurs. If one can prevent the overexpression of BCAN from moving to the proper location, one may be able to prevent proper invasion. The rhythms of proteolytic cleavage of BCAN should also be explored in that this cleavage is necessary but not sufficient for invasion to occur (Zhang et al. 2024). If indeed cleavage of BCAN is under circadian control as cleavage of certain portions of PNNs appears to be, then treatments altering cleavage must take into account the rhythms of the enzyme involved.
Technical Considerations
In reference to the non-significant findings from the 40x images, there are multiple considerations to be kept in mind while analyzing them. Firstly, it is possible that the area considered was simply too small to provide sufficient differentiation from day to night. Other studies on this topic have used 40x without zoom or 20x respectively (Pantazopoulos et al. 2022 and Harkness et al. 2022) while this study chose to use 40x with reduction of resolution to 512×512 pixels and 4.69x zoom. This may have impaired the ability to collect enough bulk data to see a significant difference, as may be portrayed best by the Ca1 data where most pictures only returned 2-4 PNNs. This zoom was initially used to attempt to see if there is significant BCAN surrounding the blood vessels of the brain which returned non-significant patterns and will be corrected in further replications.
In discussion on the odd flipping of patterns in the SCN in which 20x photos returned an antiphase rhythm in the SCN-D while 40x photos showed this for the SCN-V, more research must be done. The SCN is the main control center for circadian rhythms and is incredibly sensitive to light. If, in fact, BCAN and PNNs as a whole are under circadian control, more questions must be asked about what role the SCN plays in this as its rhythmic activity may be different from the rest of the neural regions examined in this study. It is difficult to attempt to explain the results found in these areas without further knowledge of what actually modulates the presence of BCAN and PNNs and when it is doing this. Along with this, the SCN has incredibly dense neural groupings and is difficult to analyze with the current methods of PNN counting. No other study so far has attempted to count PNNs in the SCN, and it is clear why. For these reasons, the conclusions made in this paper apply only to the neural regions in which significant relationships could be explained based on previous research, and rhythms of PNNs in the SCN will continue to elude us.
References
- Becker-Krail D, McClung C. 2016. Implications of circadian rhythm and stress in addiction vulnerability. F1000Research. 5:59. doi:https://doi.org/10.12688/f1000research.7608.1.
- Cord Brakebusch, Seidenbecher CI, Fredrik Asztély, Rauch U, Matthies H, Meyer H, Krug M, Böckers TM, Zhou X, Kreutz MR, et al. 2002. Brevican-Deficient Mice Display Impaired Hippocampal CA1 Long-Term Potentiation but Show No Obvious Deficits in Learning and Memory. Molecular and Cellular Biology. 22(21):7417–7427. doi:https://doi.org/10.1128/mcb.22.21.7417-7427.2002.
- Costa IC, Carvalho HN, Fernandes L. 2013. Aging, circadian rhythms and depressive disorders: a review. American Journal of Neurodegenerative Disease. 2(4):228. https://pmc.ncbi.nlm.nih.gov/articles/PMC3852564/.
- EDERY I. 2000. Circadian rhythms in a nutshell. Physiological Genomics. 3(2):59–74. doi:https://doi.org/10.1152/physiolgenomics.2000.3.2.59.
- Frischknecht R, Seidenbecher CI. 2012. Brevican: A key proteoglycan in the perisynaptic extracellular matrix of the brain. The International Journal of Biochemistry & Cell Biology. 44(7):1051–1054. doi:https://doi.org/10.1016/j.biocel.2012.03.022.
- Greene MW. 2012. Circadian rhythms and tumor growth. Cancer Letters. 318(2):115–123. doi:https://doi.org/10.1016/j.canlet.2012.01.001. https://www.sciencedirect.com/science/article/pii/S0304383512000249.
- Harkness JH, Gonzalez AE, Bushana PN, Jorgensen ET, Hegarty DM, Di AA, Alain Prochiantz, Wisor JP, Aicher SA, Brown TE, et al. 2021. Diurnal changes in perineuronal nets and parvalbumin neurons in the rat medial prefrontal cortex. Brain Structure & Function. 226(4):1135–1153. doi:https://doi.org/10.1007/s00429-021-02229-4. https://www.ncbi.nlm.nih.gov/pmc/articles/PMC8086998/.
- Kondratov RV, Kondratova AA, Gorbacheva VY, Vykhovanets OV, Antoch MP. 2006. Early aging and age-related pathologies in mice deficient in BMAL1, the core component of the circadian clock. Genes & Development. 20(14):1868–1873. doi:https://doi.org/10.1101/gad.1432206. http://genesdev.cshlp.org/content/20/14/1868.short.
- Meyer N, Faulkner SM, McCutcheon RA, Pillinger T, Dijk D-J, MacCabe JH. 2020. Sleep and Circadian Rhythm Disturbance in Remitted Schizophrenia and Bipolar Disorder: A Systematic Review and Meta-analysis. Schizophrenia Bulletin. 46(5):1126–1143. doi:https://doi.org/10.1093/schbul/sbaa024.
- Pantazopoulos H, Gisabella B, Rexrode L, Benefield D, Yildiz E, Seltzer P, Valeri J, Chelini G, Reich A, Ardelt M, et al. 2020. Circadian Rhythms of Perineuronal Net Composition. ENeuro. 7(4):ENEURO.0034-19.2020. doi:https://doi.org/10.1523/eneuro.0034-19.2020.
- Peeters LD, Grueter BA. 2024. Wrapping Our Minds Around Perineuronal Nets: Brevican Influences Nucleus Accumbens Parvalbumin Interneuron Synaptic and Behavioral Plasticity. Biological Psychiatry. 96(9):686–688. doi:https://doi.org/10.1016/j.biopsych.2024.08.013. [accessed 2024 Dec 13]. https://www.biologicalpsychiatryjournal.com/article/S0006-3223(24)01546-4/fulltext.
- Reichelt AC, Hare DJ, Bussey TJ, Saksida LM. 2019. Perineuronal Nets: Plasticity, Protection, and Therapeutic Potential. Trends in Neurosciences. 42(7):458–470. doi:https://doi.org/10.1016/j.tins.2019.04.003.
- Slaker ML, Harkness JH, Sorg BA. 2016. A standardized and automated method of perineuronal net analysis using Wisteria floribunda agglutinin staining intensity. IBRO Reports. 1:54–60. doi:https://doi.org/10.1016/j.ibror.2016.10.001.
- Testa D, Prochiantz A, Di Nardo AA. 2019. Perineuronal nets in brain physiology and disease. Seminars in Cell & Developmental Biology. 89:125–135. doi:https://doi.org/10.1016/j.semcdb.2018.09.011. https://www.sciencedirect.com/science/article/abs/pii/S1084952117305797.
- Thamyris Santos‐Silva, Debora, Fernandes R, Freitas ÍS, Baeta F, Hadera V, Almeida S, Souza AJ, Gomes FV. 2024. Perineuronal nets as regulators of parvalbumin interneuron function: Factors implicated in their formation and degradation. Basic & Clinical Pharmacology & Toxicology. 134(5):614–628. doi:https://doi.org/10.1111/bcpt.13994.
- Van den Oever MC, Lubbers BR, Goriounova NA, Li KW, Van der Schors RC, Loos M, Riga D, Wiskerke J, Binnekade R, Stegeman M, et al. 2010. Extracellular Matrix Plasticity and GABAergic Inhibition of Prefrontal Cortex Pyramidal Cells Facilitates Relapse to Heroin Seeking. Neuropsychopharmacology. 35(10):2120–2133. doi:https://doi.org/10.1038/npp.2010.90.
- Wolfgang Härtig, Meinicke A, Michalski D, Schob S, Carsten Jäger. 2022. Update on Perineuronal Net Staining With Wisteria floribunda Agglutinin (WFA). Frontiers. 16. doi:https://doi.org/10.3389/fnint.2022.851988.
- Zhang H, Kelly G, Zerillo C, Jaworski D, Hockfield S. 2024. Expression of a Cleaved Brain-Specific Extracellular Matrix Protein Mediates Glioma Cell Invasion In Vivo. Jneurosciorg. https://www.jneurosci.org/content/18/7/2370.
About the Author
Isaac Morse is an undergraduate biology and psychology student at the University of Rochester. He is originally from Worcester, MA but has also lived in Boston and Guangzhou, China for periods of his life. He is heavily involved in research and theater on campus and runs the hospice club. In the future, he aspires to become a physician-scientist. He finds cancer to be an incredibly interesting disease from a biopsychosocial perspective and plans to spend his time treating patients while conducting research to gain a deeper understanding of their disease.
Cite this Article
Morse, I. and Hablitz, L. (2025). Diurnal Relocalization of Brevican in Perineuronal Nets. University of Rochester, Journal of Undergraduate Research, 23(2). doi: 10.47761/VXIM6846.
JUR | Creative Commons Attribution 4.0 BY International License