Why do some Americans vote while others stay home? URochester political scientists explain the rules, behaviors, barriers, and math behind voter turnout.
Editor’s note: This story was originally published October 30, 2024. It has been updated with new research and republished ahead of the 2026 midterm elections.
Every election ends with a count: Who won? Who lost? But University of Rochester political scientists are interested in another number, too: Who showed up?
Voter turnout sounds simple enough: How many eligible voters cast a ballot? Yet behind that number is a complicated mix of individual behaviors, institutional rules, and real-world circumstances.
For decades, URochester political scientists have used data, experiments, mathematical models, and game theory to understand who votes, what makes voting easier—or harder—and why people vote at all.
With the 2026 midterm elections approaching, their research offers a different way to understand voting: not through polls, predictions, or partisan horse races, but through the science of political behavior.
What is voter turnout—and how is it calculated?
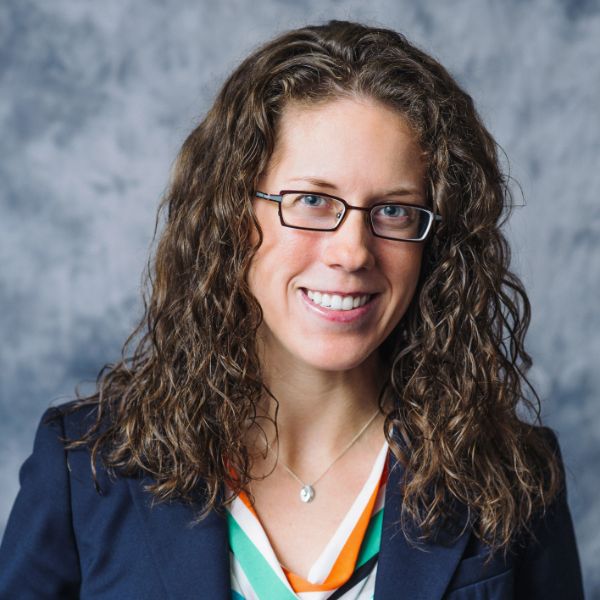
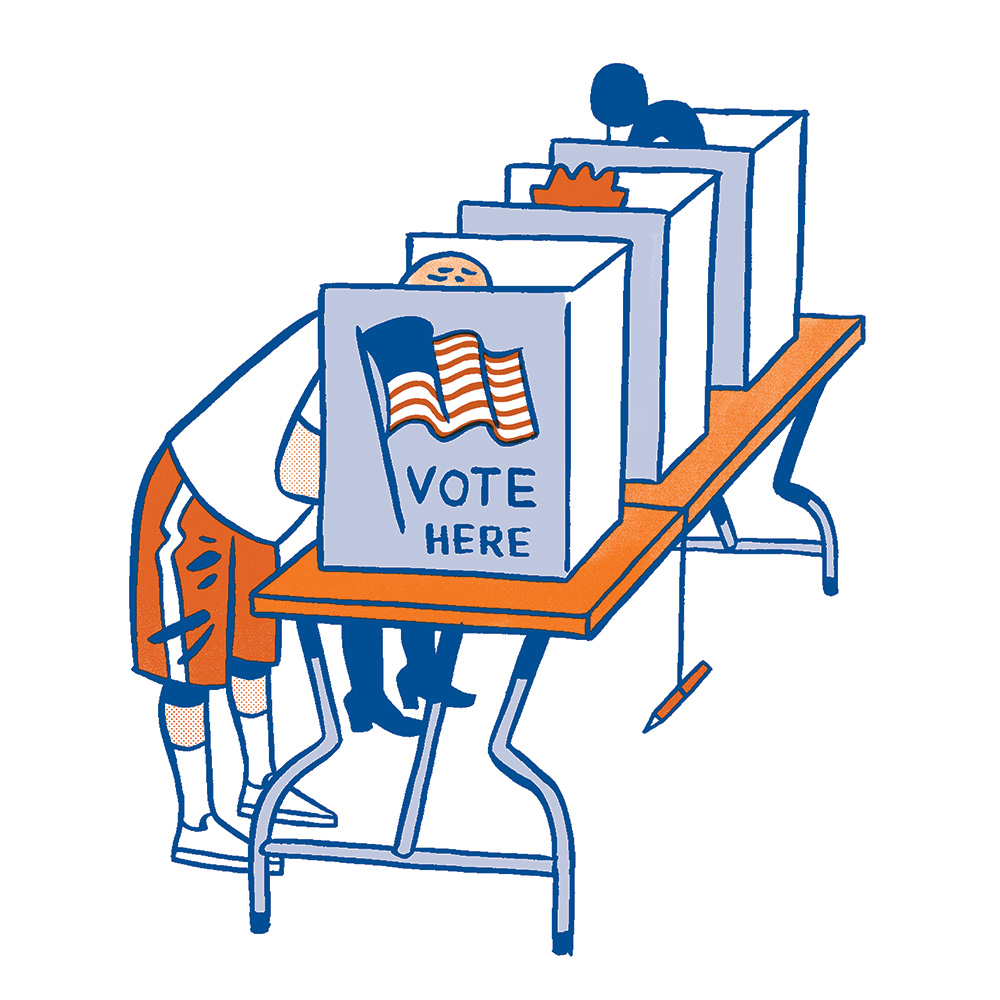 Technically, “voter turnout is the number of people who cast ballots in any given election,” says Mayya Komisarchik, an assistant professor of political science at the University of Rochester. Turnout is also expressed as a percentage: If there were 100 eligible voters and 64 people voted, turnout would be 64 percent.
Eligible is key. Total population, voting-age population, and voting-eligible population are not interchangeable. Citizenship, age, and state laws governing voting rights all affect who can cast a ballot—which means the denominator matters.
Some turnout calculations use the voting-age population, which includes adults who are not legally eligible to vote. Others use the voting-eligible population, which attempts to account for those exclusions. The distinction can change how we interpret turnout trends.
Presidential elections typically attract more voters than midterms. In recent decades, turnout in presidential elections has generally ranged from about 50 to 67 percent of eligible voters, reaching a high of 67 percent in 2020. Midterm turnout has ranged from roughly 40 to 50 percent, with particularly high participation in 2018 and 2022.
“Turnout in the US is not super-high relative to other democracies, like in Australia, where voting is compulsory with a fine for not participating,” says Komisarchik.
Why don’t more Americans vote?
“Given that we’re talking about 51 different electoral systems (each state plus Washington, DC) with multi-pronged processes, various restrictions, and lots of contestation, the voter turnout rate doesn’t surprise me,” says James Druckman, the Martin Brewer Anderson Professor of Political Science. “States vary dramatically in terms of their registration laws, early voting policies, access to polls, even when absentee ballots are counted.”
Election schedules vary, too. Some jurisdictions hold local elections alongside federal contests, while others conduct them in different years. And the country’s history of voting restrictions—from literacy tests to contemporary disputes over election rules—continues to shape who can participate.
Why does the turnout denominator matter?
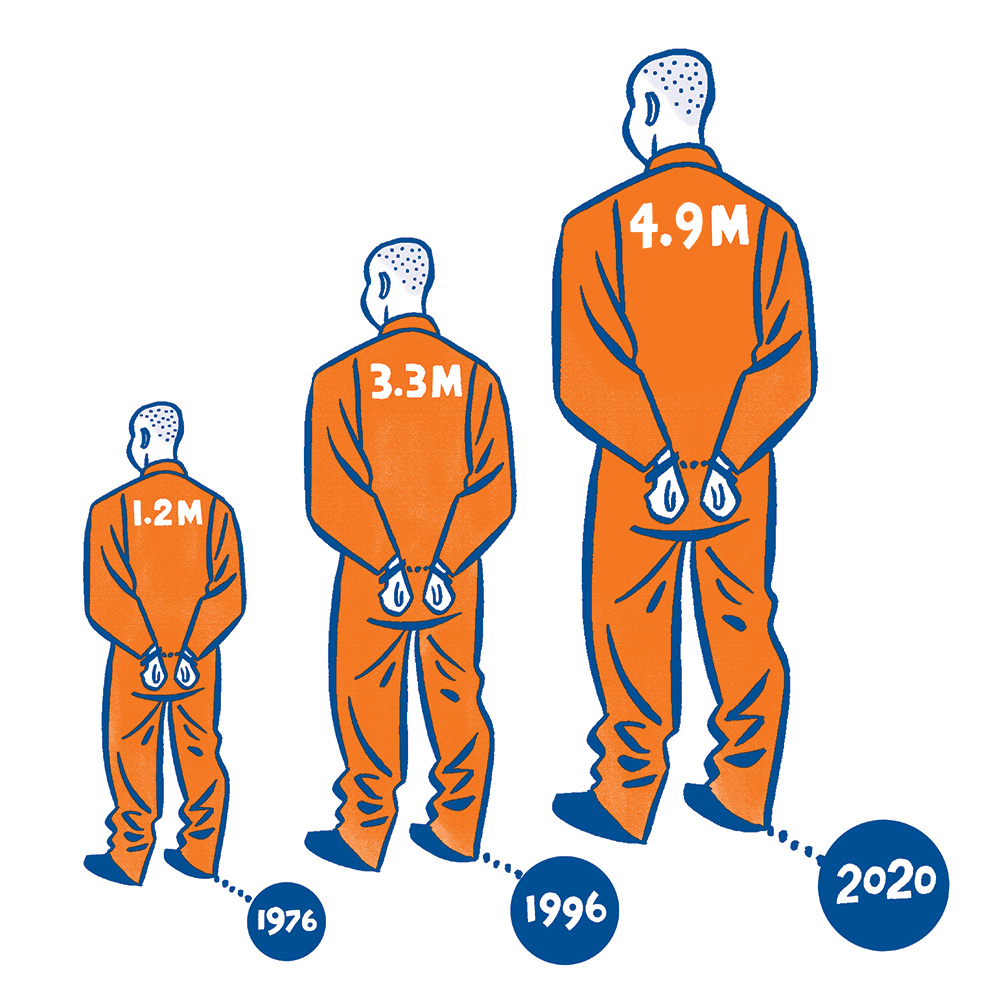 Voter turnout is often presented as a single percentage. But that number can tell different stories depending on who is counted.
As mass incarceration expanded during the late 20th century, so did the number of Americans barred from voting because of felony convictions. According to the Sentencing Project, an estimated 1.2 million Americans were disenfranchised in 1976, compared with 3.3 million in 1996 and approximately 4.9 million in 2020.
“Because we often divide voters by the entire voting-age population, voter turnout appeared to decline through the 1970s, ’80s, and ’90s,” says Druckman. “In reality, this is explained by the growing disenfranchisement rate of felons.”
The distinction matters: When adults who cannot legally vote remain in the denominator, turnout can appear lower than it would among eligible voters.
“Voter turnout appeared to decline through the 1970s, ’80s, and ’90s. In reality, this is explained by the growing disenfranchisement rate of felons.” –James Druckman
Felony-disenfranchisement laws vary widely by state. Some people retain the right to vote while incarcerated; others lose it temporarily or for longer periods. Changes in those laws can affect both the number of eligible voters and how turnout statistics should be interpreted.
The broader lesson is that understanding turnout requires asking not only how many people voted, but also who was eligible to vote in the first place.
Who gets to vote? How voting rights have changed
 The history of voter turnout in the United States is also a history of who has been permitted to participate.
The 15th Amendment, ratified in 1870, prohibited denying the right to vote on account of race, color, or previous condition of servitude. But discriminatory practices continued to prevent many Black Americans from voting.
In 1920, the 19th Amendment prohibited denying the right to vote on account of sex, following decades of advocacy by the women’s suffrage movement. Rochester’s own Susan B. Anthony famously voted in the 1872 presidential election—nearly half a century before the amendment’s ratification—and was subsequently arrested.
The Voting Rights Act of 1965 prohibited discriminatory voting practices and established federal oversight of changes to voting laws in certain jurisdictions with histories of discrimination.
The Supreme Court’s 2013 decision in Shelby County v. Holder effectively ended that preclearance system. In subsequent research, Komisarchik and political scientist Ariel White found little change in Black-white turnout gaps during the period they studied, despite changes in some election rules. More recently, the Supreme Court’s 2026 decision in Louisiana v. Callais tightened the requirements for challenging potentially racially discriminatory voting maps under the Voting Rights Act.
Together, these developments illustrate why voter turnout cannot be understood separately from the laws that determine who may vote and under what conditions.
Why vote if your ballot probably won’t decide the election?
In most elections, the probability that one ballot will determine the outcome is extraordinarily small. So why do millions of people vote anyway?
That puzzle helped launch the Rochester School of Political Science.
In 1968, University of Rochester political scientist William Riker and Peter Ordeshook ’69 (PhD) developed a mathematical model to explain why voting can still be rational even when the odds of casting the decisive ballot are vanishingly small.
Their equation—R = P × B − C + D—considers the probability that a vote will be pivotal (P), the benefit of a preferred candidate winning (B), the cost of voting (C), and the value a person derives from voting itself (D).
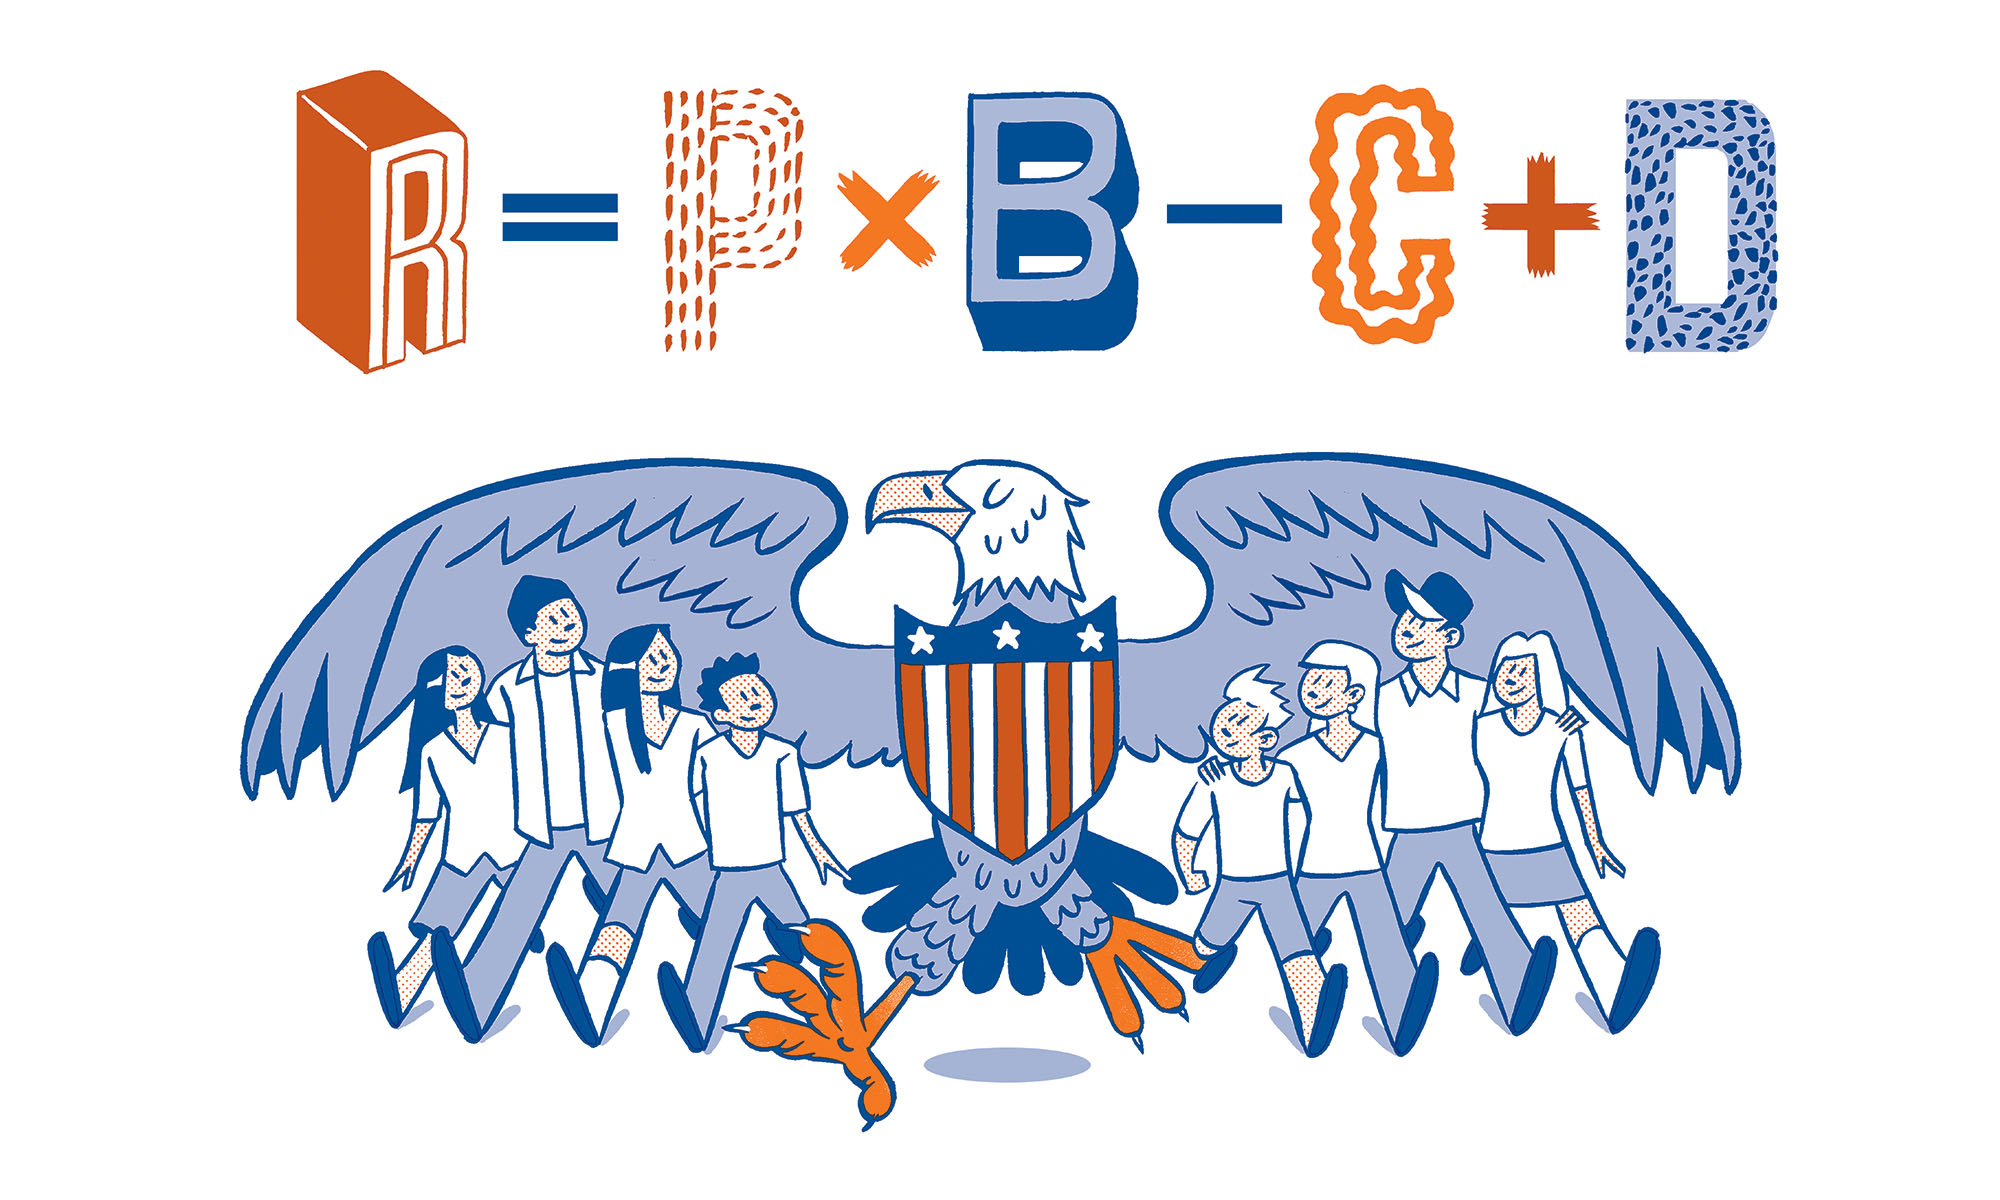
The model helped establish a new way of studying political behavior through mathematics, economics, and game theory.
“Rational choice theory is an umbrella term for considering instrumental motivations that voters might have. In other words, what compels a person to vote?” explains political scientist Scott Tyson.
“Voting isn’t just about duty. It’s part of being in a community. You see your neighbors. You look each other in the eye. You’re part of something together.” –Scott Tyson
For many people, the answer extends beyond the election result. Voting can provide a sense of civic responsibility, personal satisfaction, or connection to a larger community.
In other words, sometimes showing up is the point.
How do barriers to voting affect turnout?
Voting requires time, information, transportation, and access to a polling place. Researchers have long known that these practical costs can discourage participation. But measuring their effects is surprisingly difficult.
 That’s because voters often compensate for obstacles with countermeasures. They arrange transportation, seek information about polling locations, or receive assistance from campaigns and community organizations.
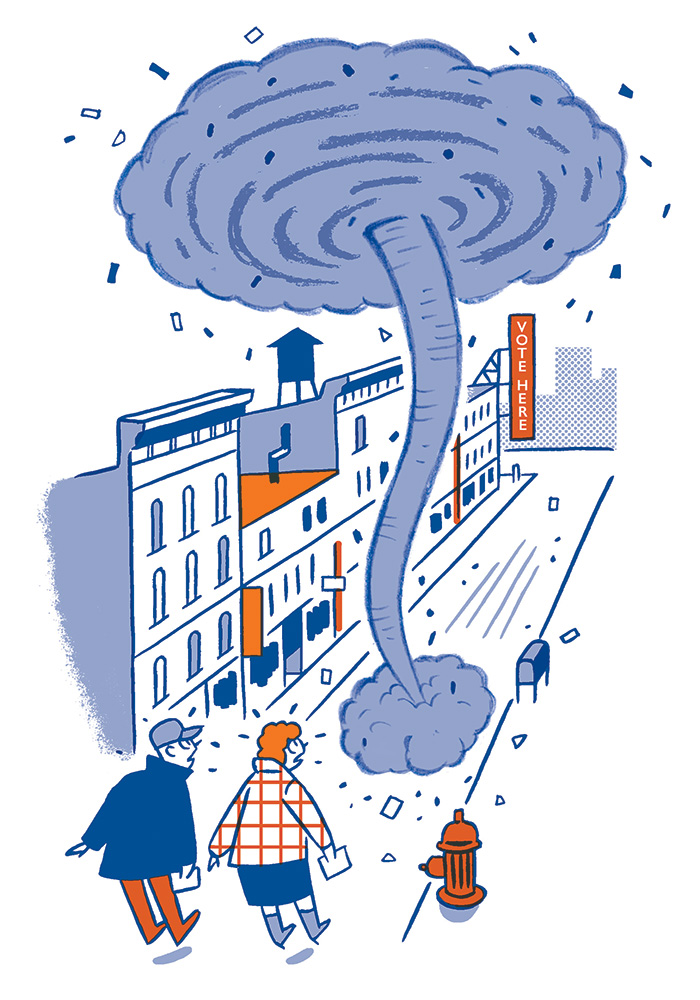
A natural disaster in Tennessee gave researchers an unusual opportunity to observe what happens when those countermeasures are suddenly disrupted.
On March 3, 2020, a tornado struck Nashville just hours before polls opened for the presidential primaries, forcing election officials to consolidate 21 voting precincts into six.
For Scott Abramson and coauthor Sharece Thrower, the unexpected disruption created a natural experiment: an opportunity to study the direct effects of polling-place closures before voters and campaigns had time to adjust.
“The tornado gave us something we almost never get: a chance to see the direct cost of making voting harder before anyone has time to compensate for it.” –Scott Abramson
Their research, published in 2025, provides evidence about the costs of changing where people vote—and why even seemingly straightforward election-administration decisions can affect participation.
Is voting a habit?
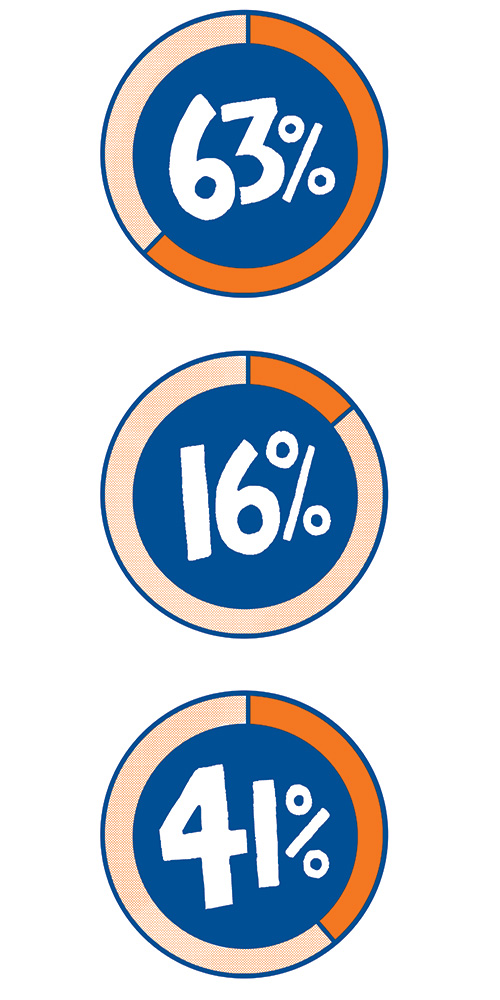
One of the strongest predictors of whether someone will vote in an election is whether they’ve voted before.
Recent data illustrate the difference between older and younger voters.
According to a 2025 Pew Research Center analysis of validated voting records, 63 percent of adults 65 and older who were eligible for the 2020, 2022, and 2024 elections voted in all three.
Among young adults old enough to vote in all three elections, just 16 percent did so. And 41 percent of those young adults voted in none of the three.
Age is not the only factor. Education, residential stability, election experience, and access to information can also influence participation.
For younger adults, voting may involve navigating unfamiliar registration requirements, changing addresses, and competing demands on their time. Older voters, meanwhile, have often had decades to establish voting routines.
“Voting habituates. The key determinant of voting in any given election is whether you have voted before.” –James Druckman
The pattern suggests that turnout is not simply a matter of deciding whether an election matters. It can also reflect habits formed—or not formed—over time.
Does easier voter registration increase turnout?
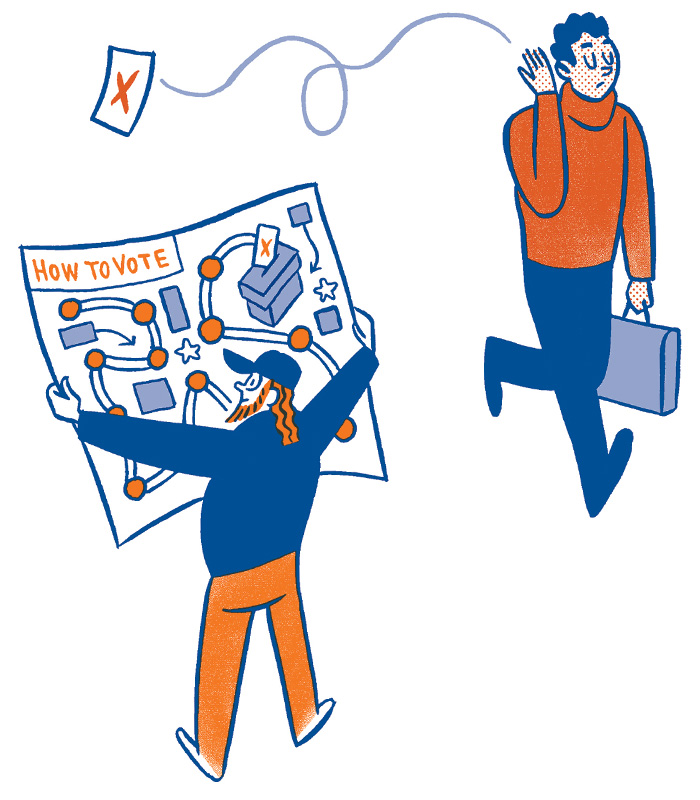 Even among Americans who are eligible to vote, registration can be a significant hurdle.
According to the US Census Bureau, 73.6 percent of the citizen voting-age population reported being registered to vote in the 2024 presidential election. That means roughly one in four was not registered.
One approach to reducing that barrier is same-day voter registration, which allows eligible people to register and cast a ballot during the same visit. Per the National Conference of State Legislatures, as of March 2026, 24 states and the District of Columbia had implemented some form of same-day or Election Day registration.
“Voters need time, the ability to navigate local voting systems, and often a little encouragement. The more accessible those things are, the more likely people are to participate.” –Mayya Komisarchik
But registration is only one part of the process. Voters also need to know when and where to vote, how to get there, and what rules apply in their jurisdiction.
Research also suggests that helping voters make a specific plan—when they will vote, where they will go, and how they will get there—can reduce some of the practical and mental burden of participation.
Why do paper ballots still matter?
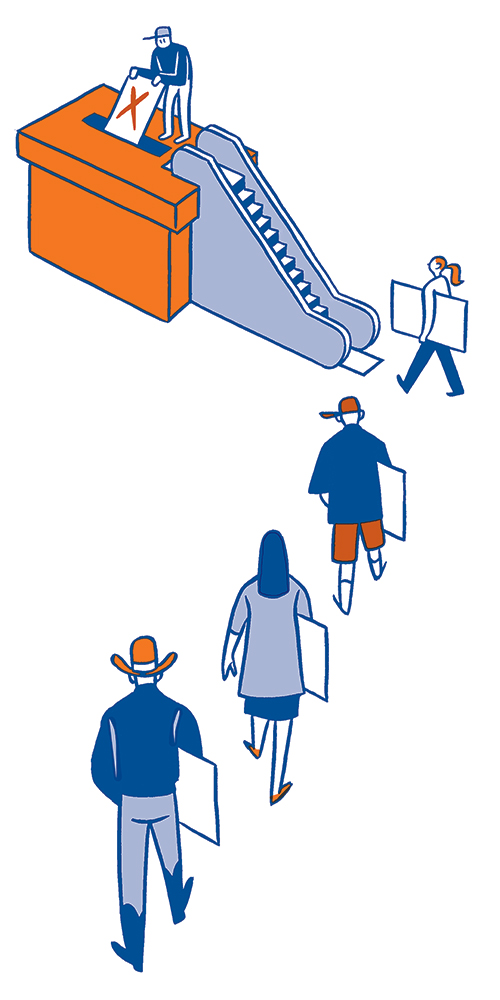 Making voting more convenient can reduce barriers to participation. But convenience must be balanced against the need for elections to be secure, auditable, and verifiable.
Could voting eventually become as easy as making a purchase online? Komisarchik cautions that eliminating the logistical costs of voting is not the only consideration.
“The tricky thing about voting is that if we removed all logistics and other ‘costs,’ it would be easier,” she says. “People could vote from the convenience of their homes. However, we also need elections to be secure, auditable, and verifiable—with a ‘paper trail.’”
Physical ballots provide a record that election officials can examine and recount independently of electronic systems.
The challenge for election administrators is to make voting accessible without sacrificing the safeguards that help people trust the results.
“In a world of eroding trust and mounting disinformation, paper ballots actually give us security.” –Mayya Komisarchik
Meet your experts
James Druckman
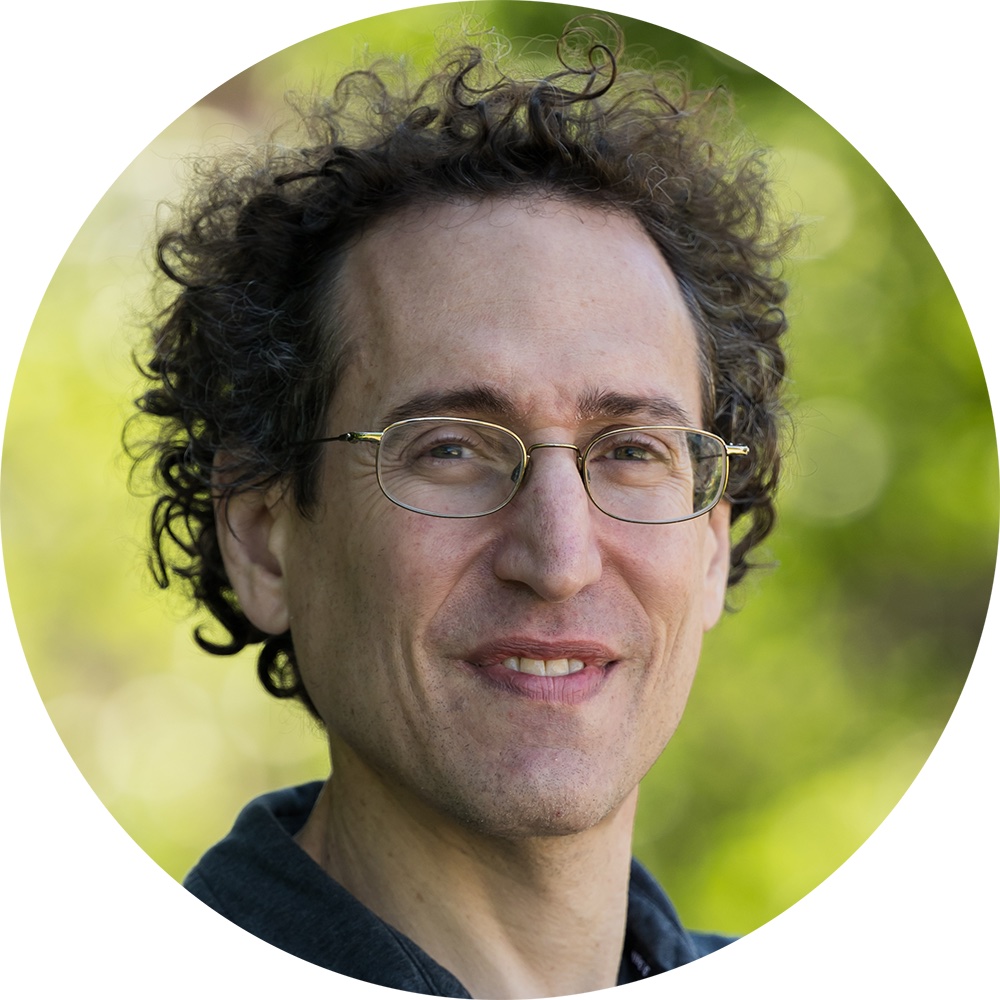 Martin Brewer Anderson Professor of Political Science
An expert in political behavior and a member of the American Academy of Arts and Sciences, Druckman studies public opinion formation, political polarization, political and scientific communication, political psychology, and experimental and survey methods. He has published approximately 200 articles and book chapters. His latest coauthored book, Partisan Hostility and American Democracy: Explaining Political Divisions and When They Matter (University of Chicago), was published in 2024.
Mayya Komisarchik
 Assistant Professor of Political Science
Komisarchik’s research interests cover representation, voting rights, race and ethnic politics, policing, immigration, and political incorporation. Her recent work has addressed changing electoral rules in southern counties in the wake of the Voting Rights Act, the lasting effects of Japanese-American internment, representativeness in policing, and the political incorporation of immigrants to the United States. Her work appears in the American Journal of Political Science and the Journal of Politics.
Scott Tyson
 Professor of Political Science
Tyson’s research focuses on formal political theory, political economy, conflict, authoritarian politics, external validity, and experimental design. He has authored or coauthored scholarly articles that have appeared in the Journal of Politics, American Journal of Political Science, American Political Science Review, Political Science Research and Methods, and PS: Political Science and Politics.
 Scott Abramson
Associate Professor of Political Science
Scott Abramson’s research spans comparative politics, international relations, and political methodology, examining how political institutions emerge, how they shape behavior, and how researchers measure political preferences. His work has appeared in leading journals, including the American Political Science Review, American Journal of Political Science, International Organization, Journal of Politics, and World Politics.
Additional reporting by Melissa Pheterson. Illustrations by Jason Ford.
A version of this story appears in the fall 2026 issue of Rochester Review, the magazine of the University of Rochester.