Skip to content
Apply
Visit
Give
Search News Center
Search
Marketing and Communications
News Center
For the media
Contact
Menu
Health & Medicine
Science & Technology
Society & Culture
Arts
Campus & Community
University News
From the Magazine
Resources
For the media
Contact
Search News Center
Search
Rochester News
Health & Medicine
Science & Technology
Society & Culture
Arts
Campus & Community
University News
From the Magazine
Close
Search News Center
Search
Rochester News
Health & Medicine
Science & Technology
Society & Culture
Arts
Campus & Community
University News
From the Magazine
Science & Technology
Unlocking big data
University Marketing and Communications
April 24, 2017
SHARE
Facebook
Share on Facebook
X/Twitter
Share on Twitter
LinkedIn
Share on LinkedIn
Unlocking big data
SHARE
Facebook
Share on Facebook
X/Twitter
Share on Twitter
LinkedIn
Share on LinkedIn
Rochester is using data science to change how we research, how we learn, and how we understand our world.
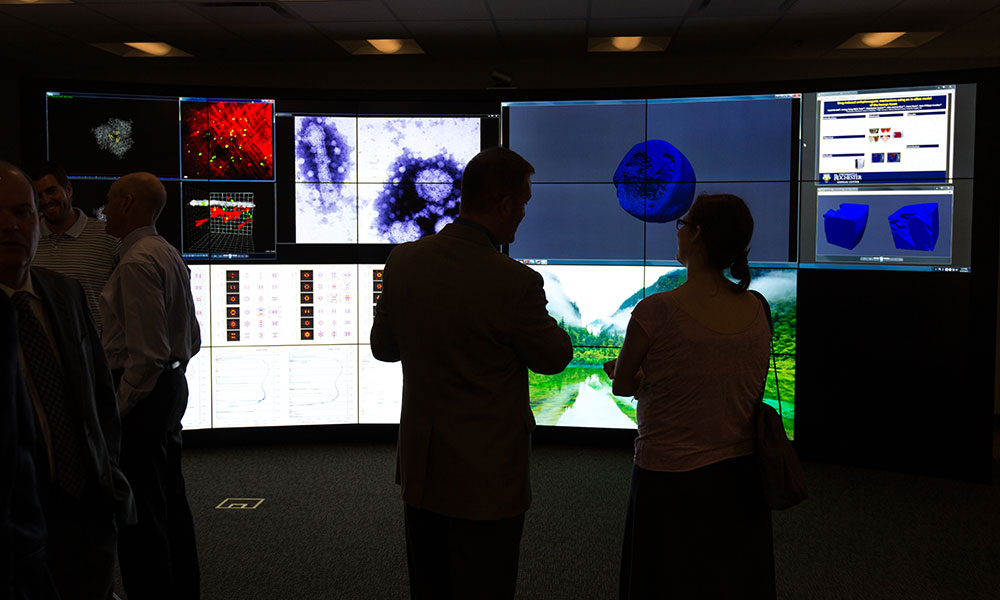
Goergen Institute for Data Science provides new opportunities for collaboration
April 24, 2017
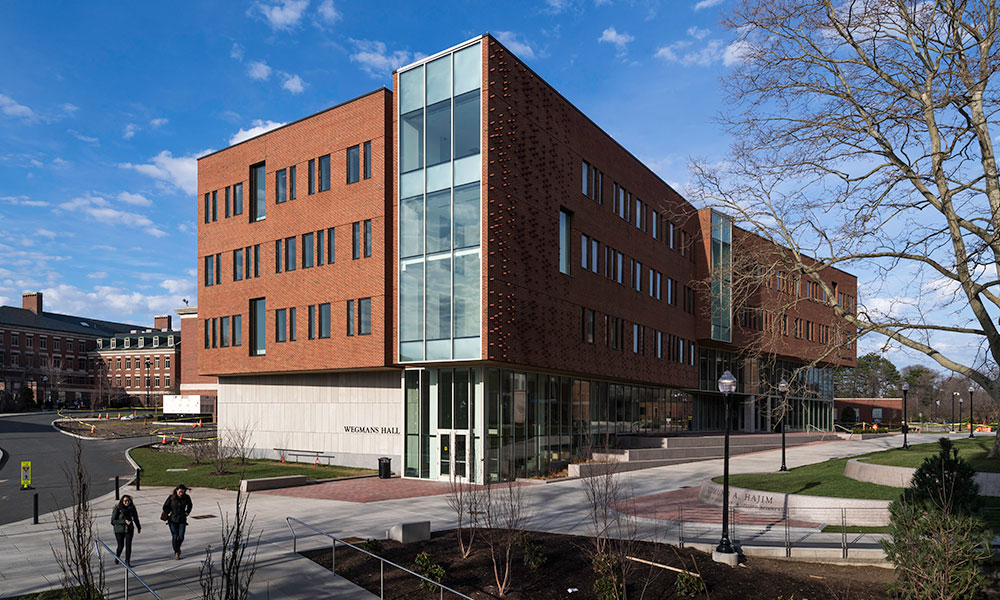
Wegmans Hall opens doors to data science
April 24, 2017
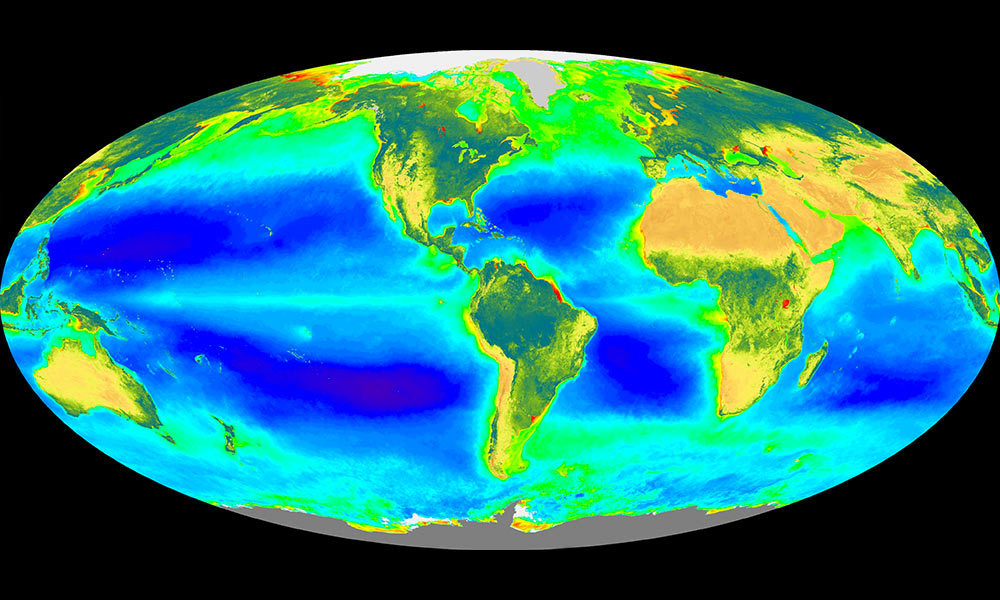
Using data science to understand global climate systems
April 21, 2017
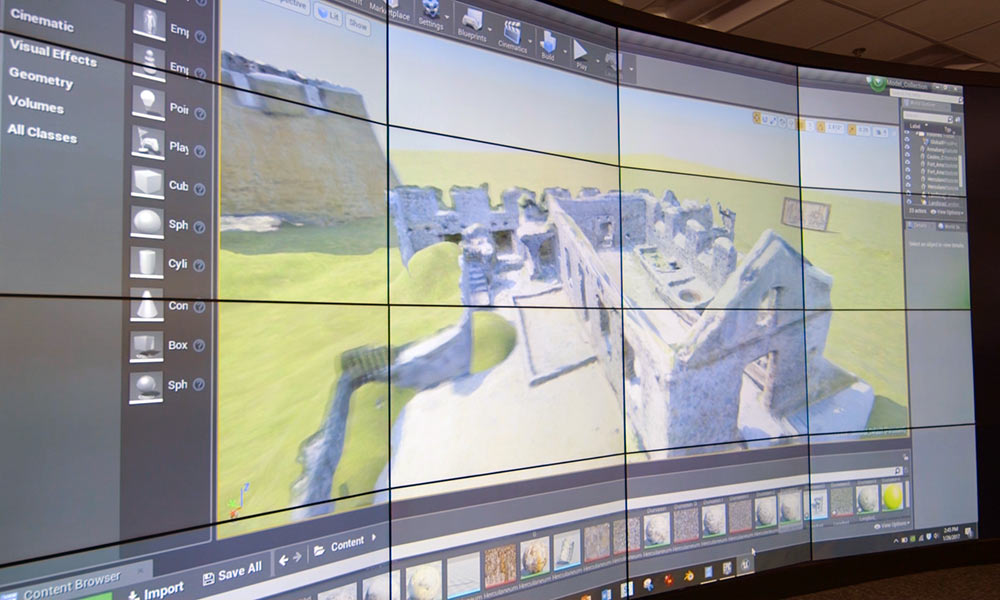
A new way to teach history in the 21st century
April 10, 2017
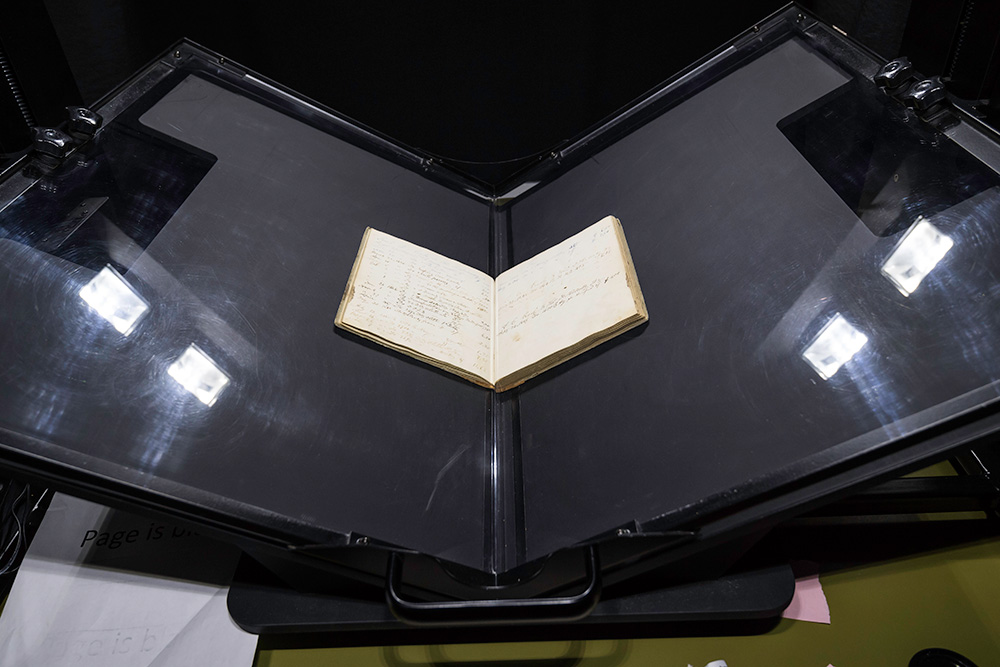
Big library, big data
April 7, 2017
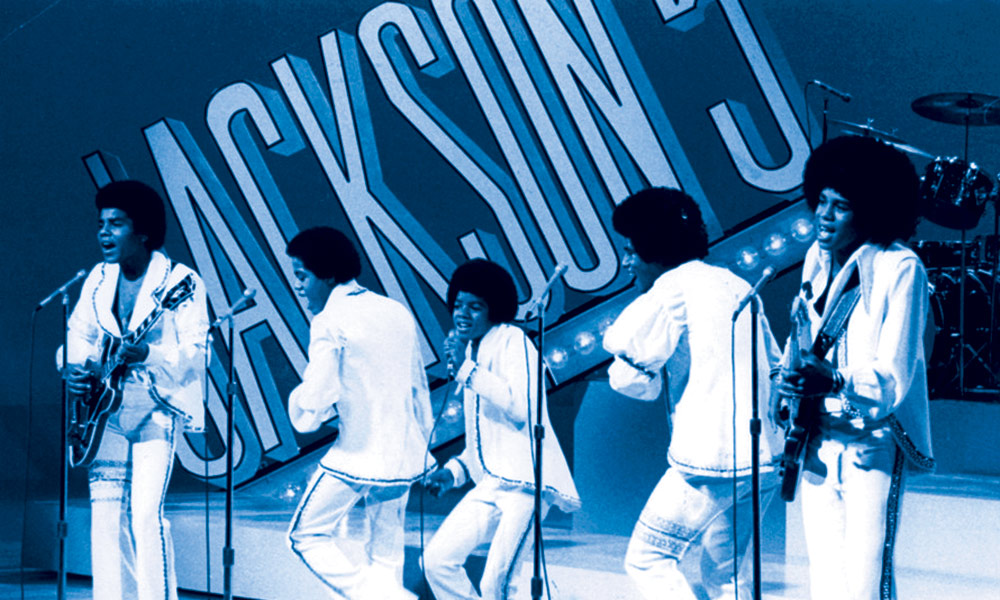
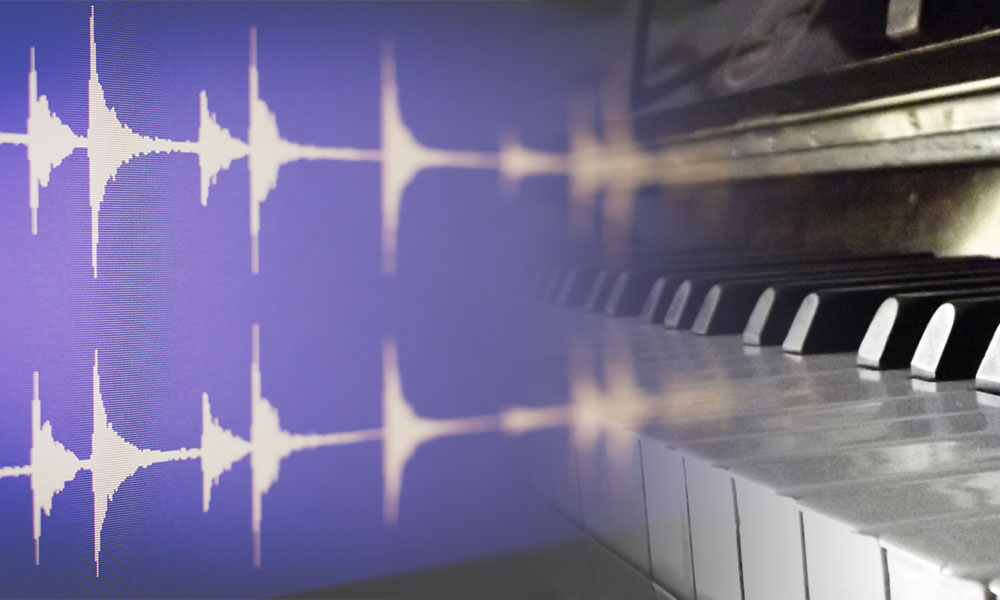
Unlocking the secrets of blue notes
March 31, 2017
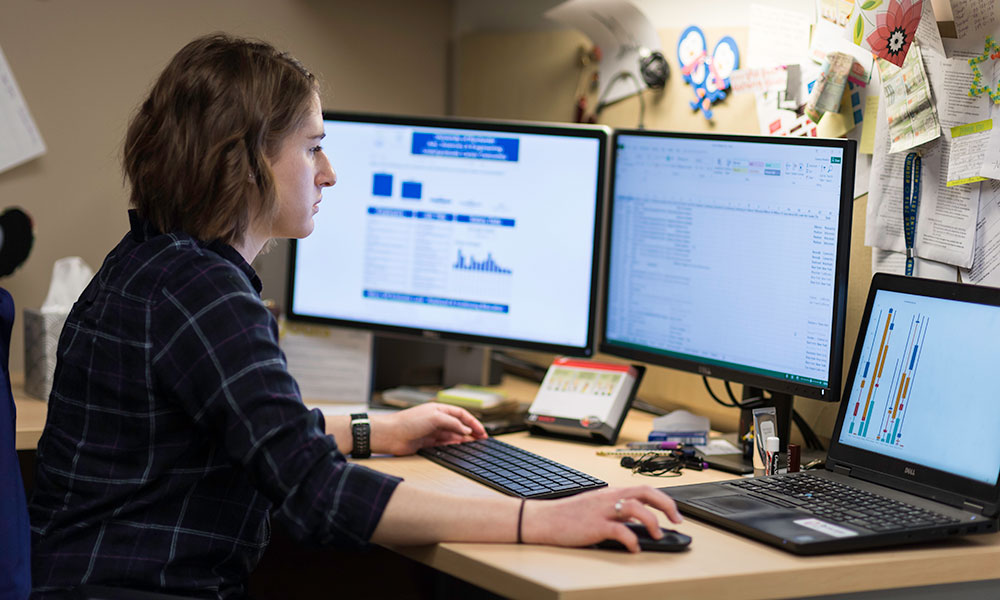
Career Center using data to connect students, employers
March 23, 2017
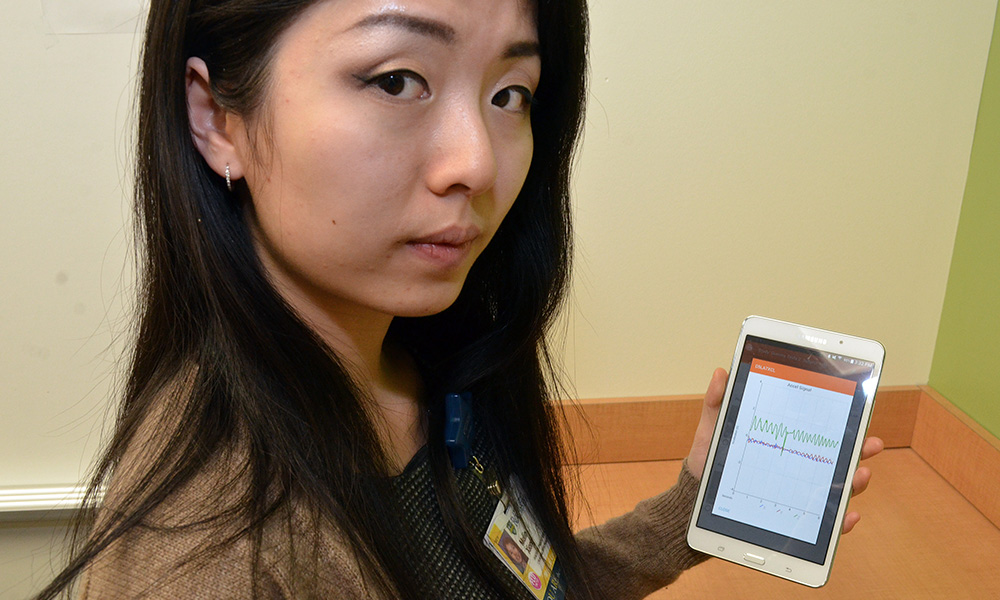
Skin sensors provide wealth of patient data
March 16, 2017
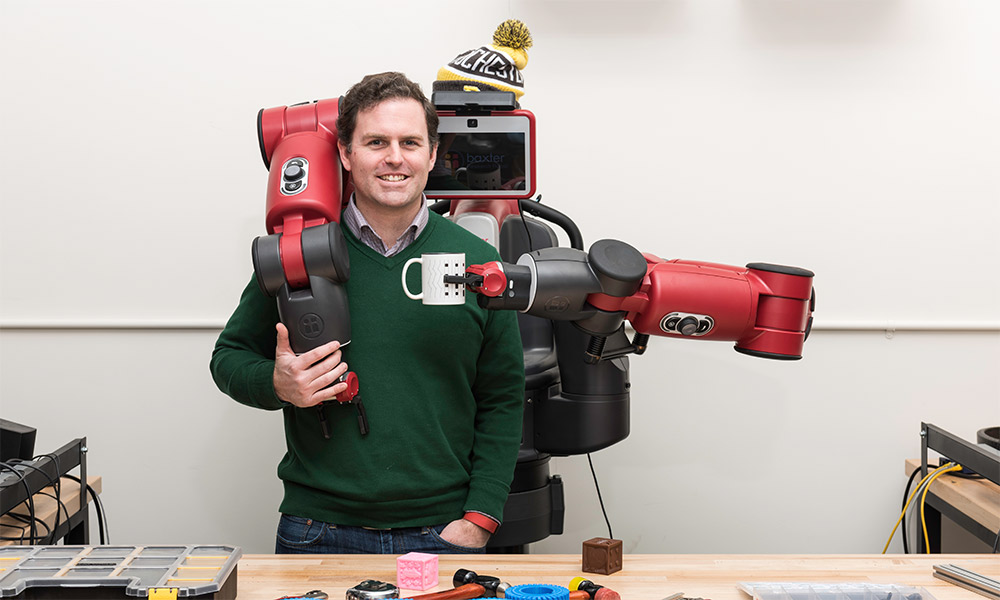
Machine learning advances human-computer interaction
March 10, 2017
The mysteries of music—and the key of data
March 6, 2017
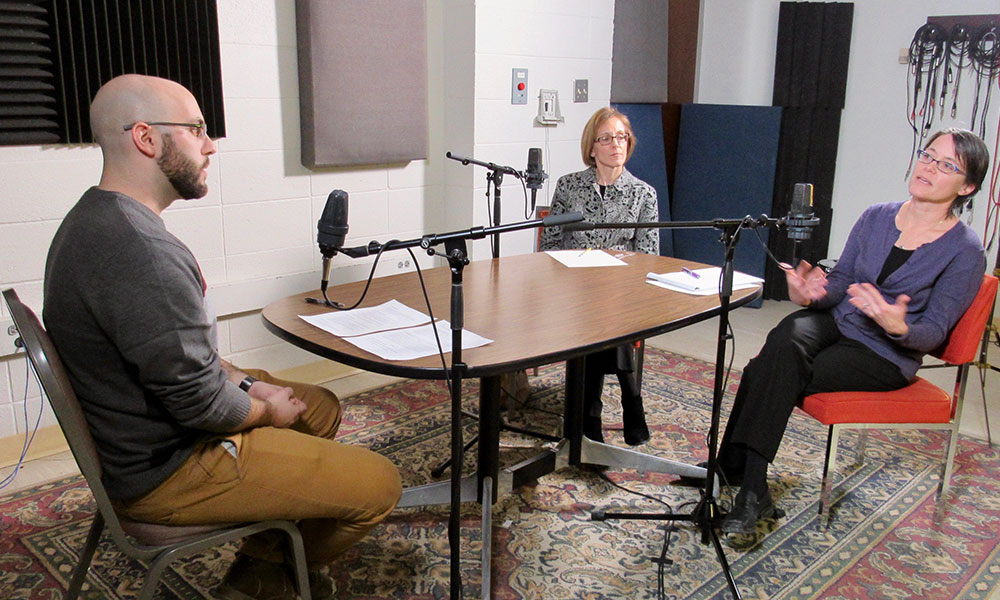
QuadCast: ‘When you have big data, you can get very lost’
February 28, 2017
Student athletes find big wins in big data
February 27, 2017
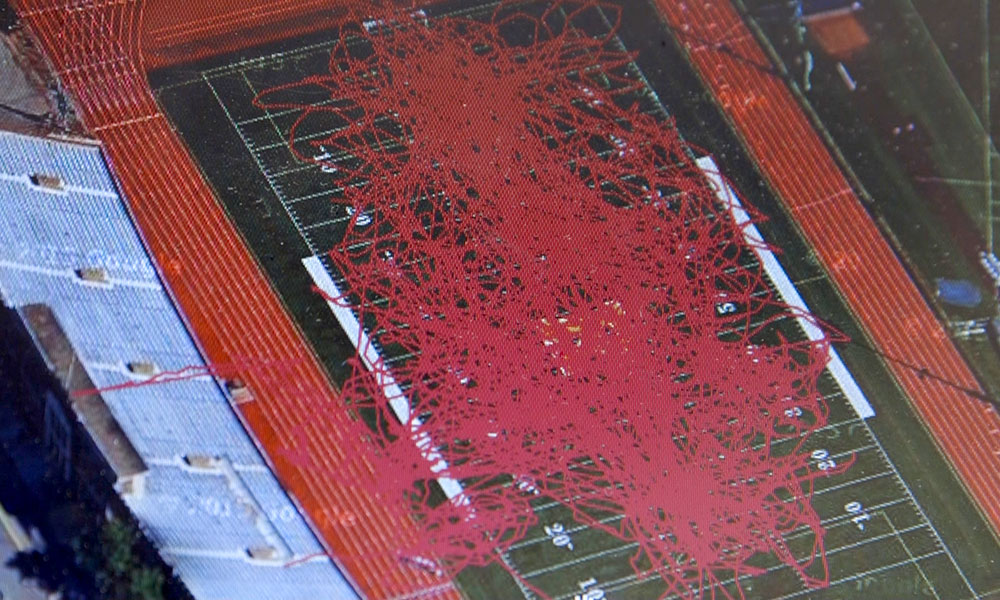
GPS sensors give women’s soccer team analytic edge
February 27, 2017
Data science for a better planet
February 24, 2017
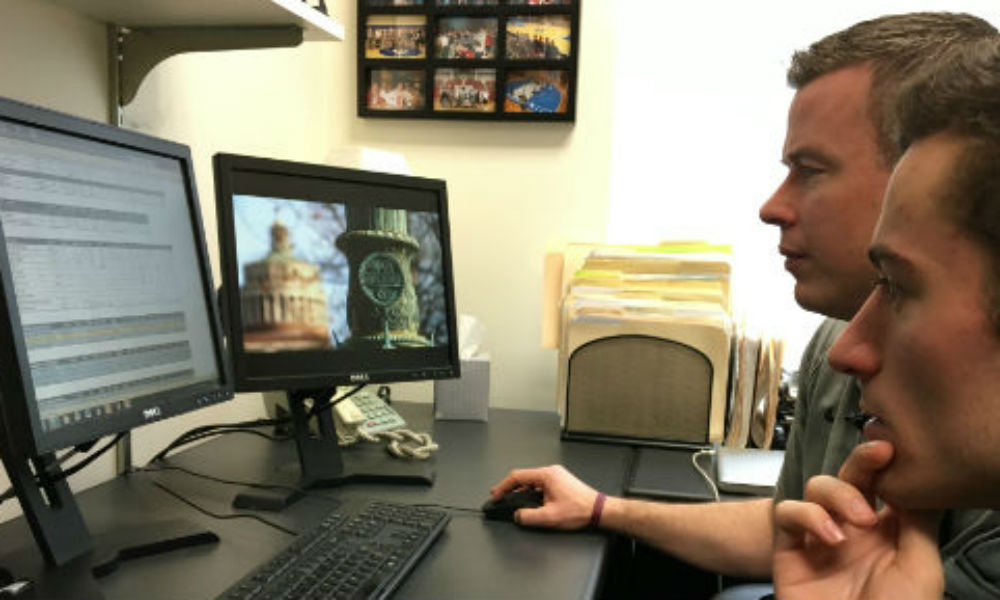
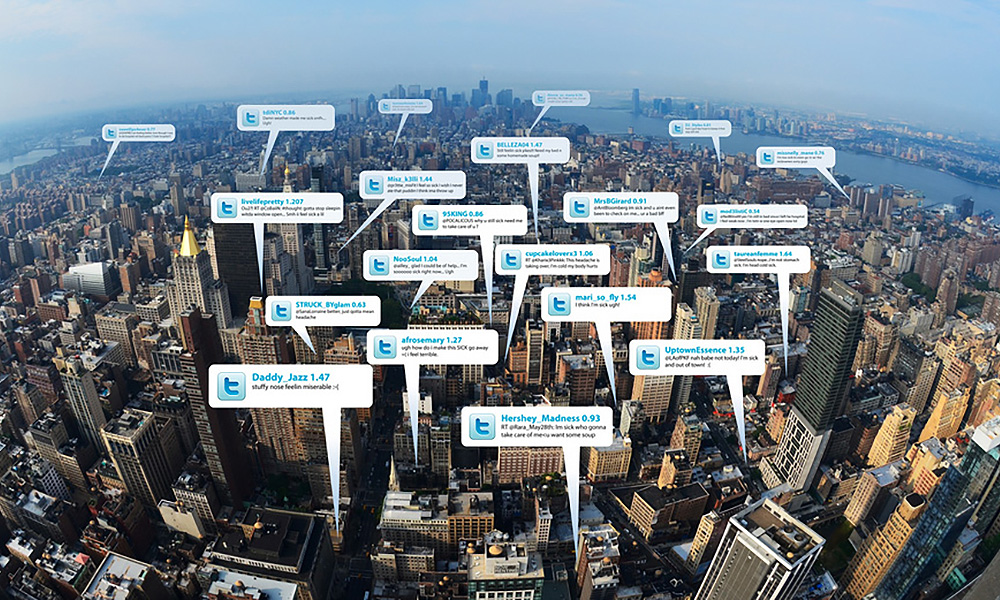
Millions of tweets are a gold mine for data mining
February 21, 2017
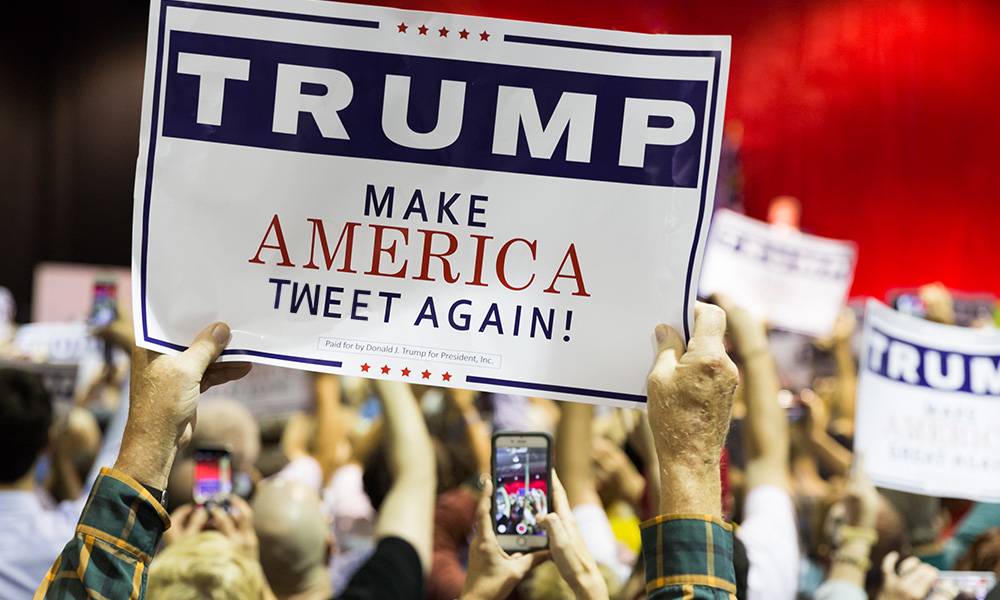
Twitter researchers offer clues for why Trump won
February 20, 2017
Science & Technology
Can AI want something? URochester awarded Templeton Foundation grant to find out
The biggest misconception about vision? That you see reality
How AI helps World Cup referees make the call
View all related items